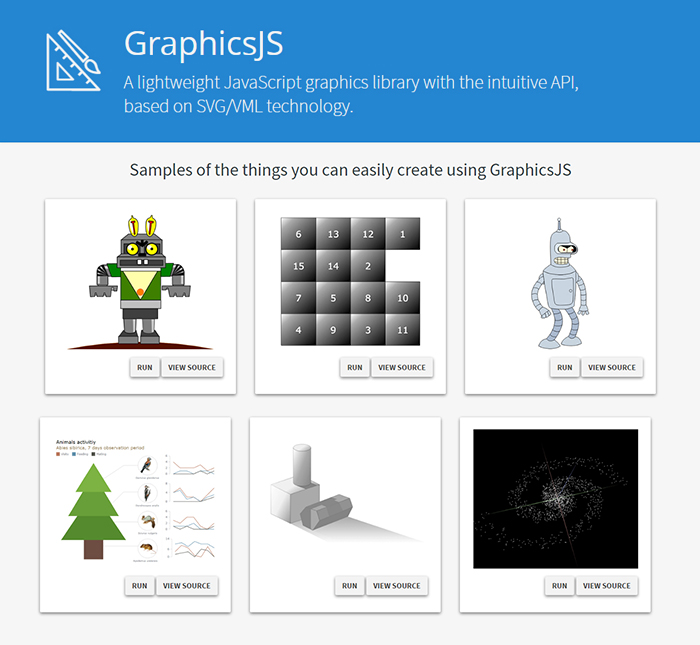
It is a pleasure for us to announce this today! We have just launched GraphicsJS, a free, open-source, lightweight JavaScript library which allows you to draw any JS graphics and animation for your HTML5 projects very easily. It is significantly more powerful and feature-rich than Raphaël, BonsaiJS, and other formerly leading SVG/VML graphics solutions.
GraphicsJS has always been the graphics engine that our JavaScript (HTML5) charting libraries are built on – AnyChart, AnyStock, AnyGantt, and AnyMap. As a result, it already powers data visualization activities for many of you – Oracle, Microsoft, Volkswagen, AT&T, Samsung, BP, Bosch, Merck, Reuters, Bank of China, Lockheed Martin, and thousands of all the other highly respected AnyChart’s customers including more than 70% of Fortune 1000 companies.
Of course, data visualization is not the only but just one of multiple fields where the library of GraphicsJS can be helpful and even essential. Generally speaking, this solution can help you produce virtually anything graphical from scratch: static and animated images, cartoons, games, interactive infographics, mind maps, and many other amazing things in HTML5.
Key Features of JS Graphics Library
- Mighty line drawing abilities – Bézier curves, arcs, rectangles, and many other kinds of forms and deformations.
- Powerful text manipulation features – multiline texts, measurement, including width, height, as well as wrap, overflow, indent, spacing, align, etc.
- Virtual DOM for drawing fast and only what is necessary.
- Smart layering system with z-index.
- Transformation engine – embarrassing in-browser transformations are not used.
- Legacy browser support (Internet Explorer 6+).
- Concise and convenient JavaScript API with chaining support.
By the way, making our graphics engine open-source is just the beginning as – we are also pleased to tell you – AnyChart is going to open the source code of our charting libraries soon! We believe that our great developments in the fields of graphics and data visualization should be even more visible and reachable to any programmer from any part of the world, not to mention that we would love to allow the community to contribute.
Please refer to GraphicsJS.org to learn more about GraphicsJS. As always, the demos are available on our Playground (Graphics section). Also, let’s not forget about the Graphics Documentation and Graphics API Reference.
What’s more, the GraphicsJS library and all relevant samples can be freely downloaded and forked on GitHub.
- Categories: AnyChart Charting Component, AnyGantt, AnyMap, AnyStock, Charts and Art, Dashboards, Financial Charts, Gantt Chart, GraphicsJS, GraphJam, HTML5, JavaScript, News, Stock Charts, Third-Party Developers, Tips and Tricks, Uncategorized
- 5 Comments »
