We use cookies to ensure that we give you the best experience on our website. If you continue to use this site we will assume that you are happy with it. Read more about our Privacy Policy and Cookie Policy
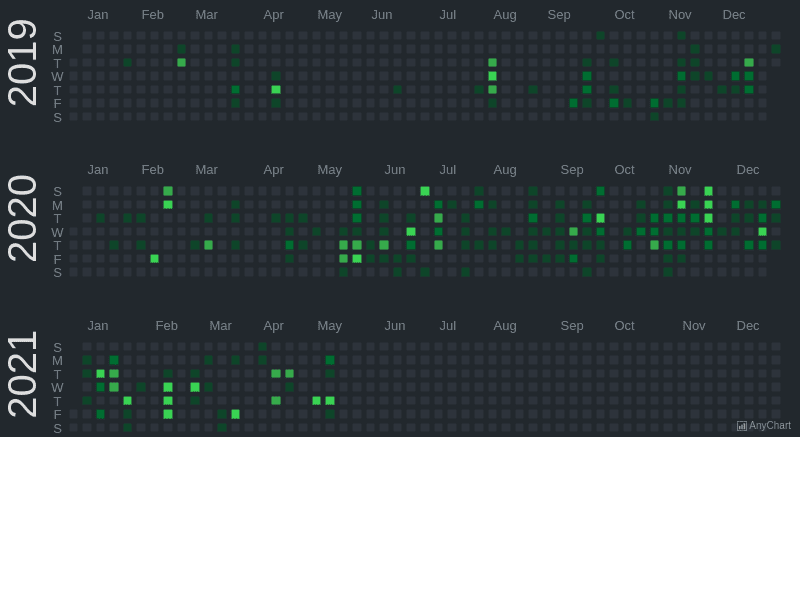
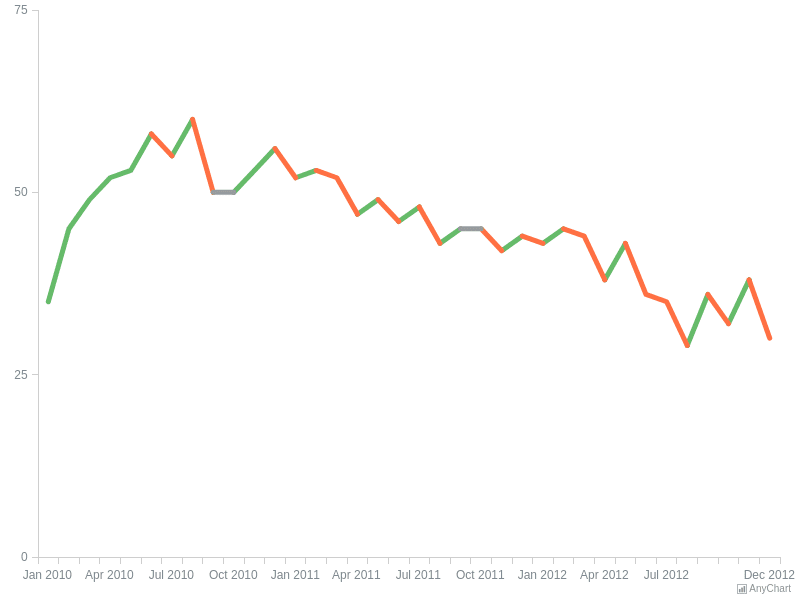
AnyStock is a lightweight JavaScript charting library that allows adding interactive
high-performance financial or timeline based charts into any desktop, web and mobile
project.
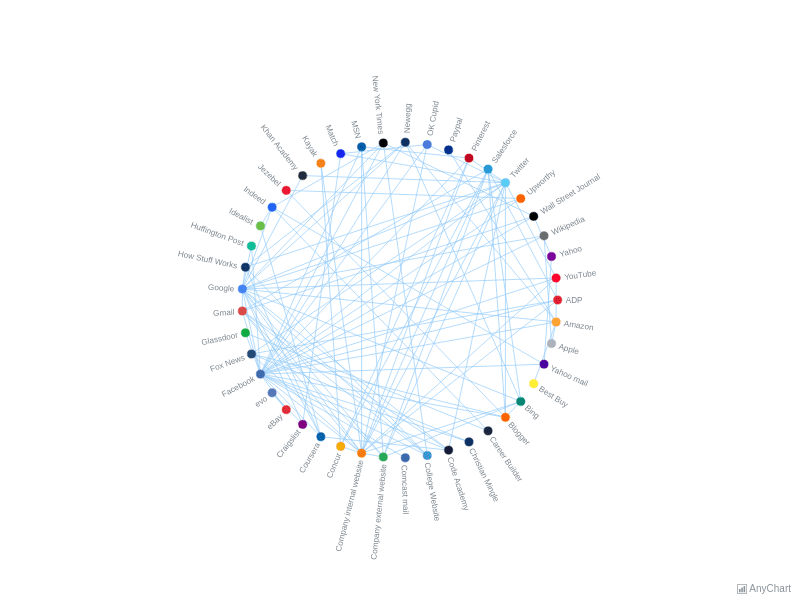
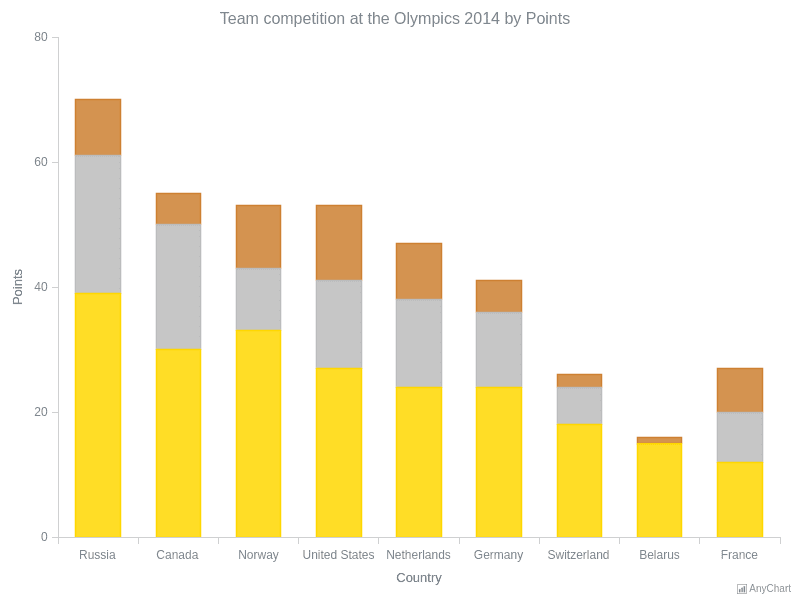
AnyMap, our JavaScript HTML5 solution, is used by 1,000’s of customers worldwide in a
multitude of applications, including Weather Forecasting, Crisis (Situational) Management,
Energy Management, and Election Results Reporting to name a few.
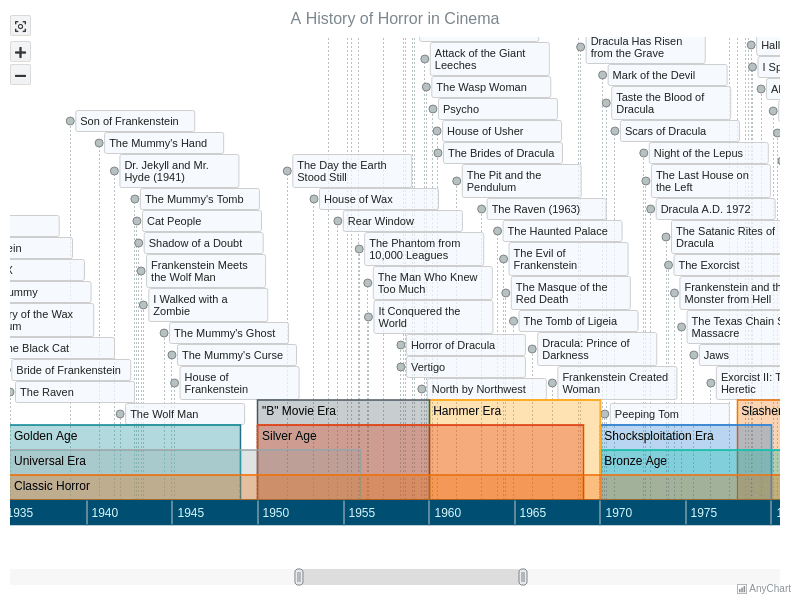
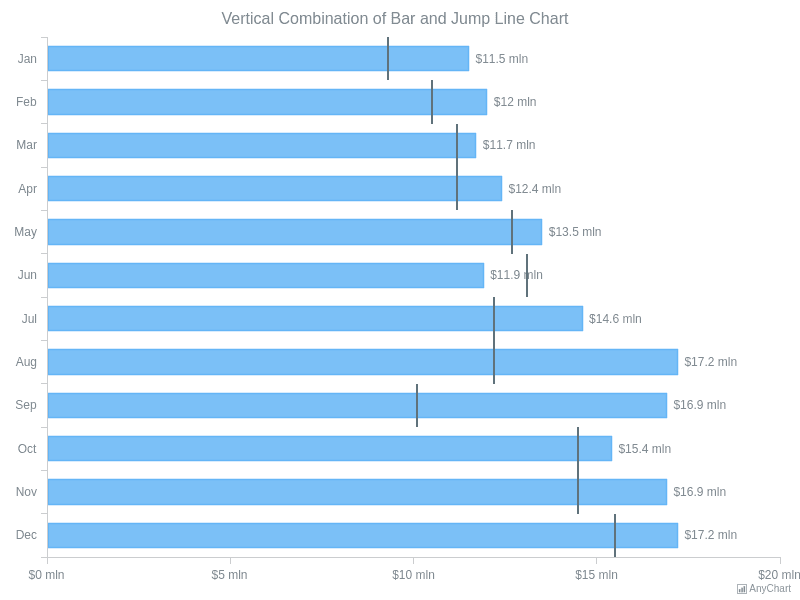
AnyGantt is an advanced JavaScript based data-visualization solution, allowing everyone to
utilize power of animation and ultimate interactivity. AnyGantt is an ideal tool for
building complex and informative Gantt charts.
charts.
recent news
Loading...
latest demos
Loading...
recent tips and tutorials
Loading...
Contact Our Sales Representatives
Our Sales Representatives will be happy to talk to you and answer any questions regarding our products, licensing, purchasing, and everything else.


-radar-chart-with-three-line-series.png)
-and-mosaic-charts-skills-and-self-id-top-factors.png)