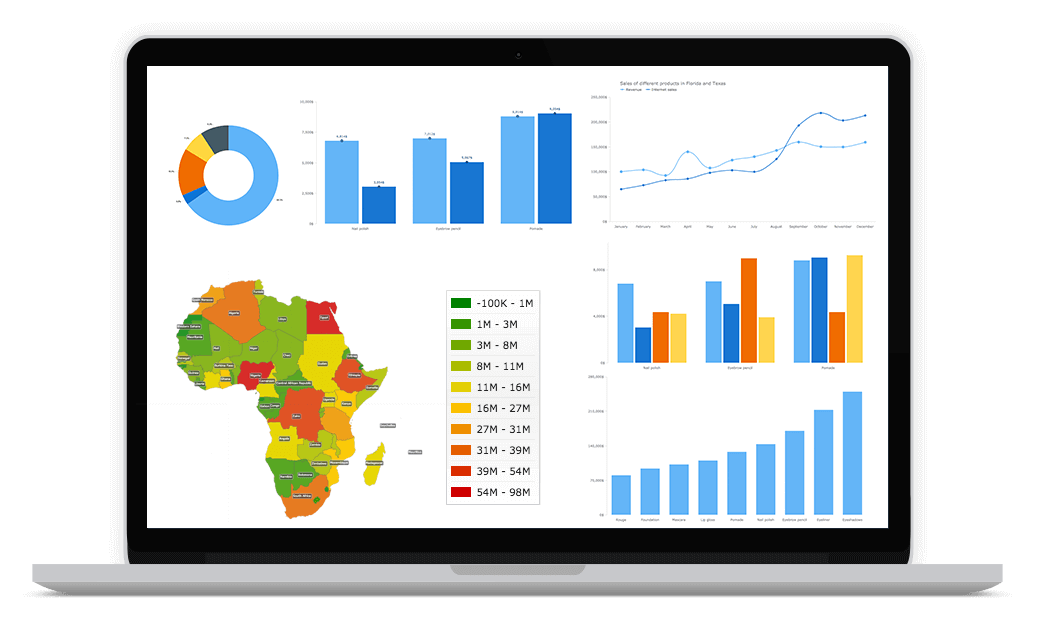
AnyChart - JS charts
Interactive JavaScript charts designed to be embedded and integrated into web, desktop, and mobile apps
Interactive JavaScript charts designed to be embedded and integrated into web, desktop, and mobile apps
Visualize and analyze financial or any timeline-based data
Add interactive map charts with drilldown and routes
Powerful HTML5 Gantt, Resource and PERT charts
Enhance the Qlik Platform with the power of AnyChart
 AnyChart — 2024 DEVIES Award Winner!
Named Best Technology in Data Analytics & Visualization!
AnyChart's product family is a set of flexible JavaScript (HTML5) libraries for all your data visualization needs. Differentiate your products, applications and web pages with beautiful charts and dashboards.

Any Chart Type:
Pie and Donut ,
Column ,
Bar ,
Line ,
Scatter ,
Cherry ,
Area ,
Range Column ,
Win/Loss Sparklines ,
Pareto Charts
and
more
Any Development Stack:
PHP,
ASP.NET,
R,
Ruby
on Rails,
Node.JS,
Angular,
Meteor,
Ember,
React,
Qlik,
jQuery
and
more
Any Feature:
Chart types,
Big Data,
Themes,
Drawing Tools,
Localization,
Technical Indicators
and
more
Any Data Source: XML, JSON, CSV, MySQL, MongoDB and more
Also: 4 Releases per Year , Great Documentation , API and more
Still not sure? Contact Us!