The very first version of AnyChart hit the shelves more than 10 years ago, check out what our products went through and see what's new in the most recent update.
Version 7.x History
AnyMap version 7.14.4
Released Nov 16, 2017Changes:
- Fixed issues with xScale/yScale setting in typescript based projects
- Fixed rendering bugs in IE 6-8
- Rework CSV export
AnyMap version 7.14.0
Released May 31, 2017
Google Spreadsheets data loader
Google Spreadsheets is an excellent popular data source. And now our Data Adapter is equipped with the capabilities to load data from there. Feel free to make good use of the Google Spreadsheets data loader, and please note: data may be taken from publicly shared documents only.- Take a look at Google Spreadsheets data loader in the Gallery.
- Check out Google Spreadsheets data loader in the Documentation.
Bug fixes:
- DVF-3014 Fixed tooltips formatting issues
- TS-32, TS-49 Fixed issues with import in Aurelia and Angular 2 frameworks
- TS-77 Fixed error with rendering rotated text in IE8
- TS-55 Fixed error occurred in case of the same coordinate in connector series
AnyMap version 7.13.1
Released April 11, 2017
Angular 2 plugin
We are happy to announce the release of the AngularJS v2.x directives for AnyChart.Zoom controls:
Zoom controls are now available, please take a look at docs article and gallery samples.Labels improvement:
One of the biggest topic of this release is Labels Improvement, we have done a great job to make the work with the component more convenient and intuitive.- Data labels settings for all chart series now can be set using single method chart.labels
- Context object for all formatting functions is now unified, see anychart.format.Context for details.
Typescript support:
Now you can use AnyChart in your TypeScript projects — we have definition file for our library which you can find in distribution folder.Bug fixes:
- DVF-1747 — Map legend issues fixed.
- DVF-2323 — Map drilling issues fixed.
- DVF-2228 — Issues with map bounds fixed.
- TS-19 — Fixed issues with AnyChart Fonts.
AnyMap version 7.13.0
Released February 28, 2017
AnyChart in Now Open
Reliability has always been our company's first priority. And you definitely know you can trust us, with our public roadmaps, consistent releases, and highly experienced Quality Assurance team. Today we are glad to tell you about another major step that we have just taken in this regard: AnyChart is now open! Basically, it means the following:- The Source code of our product is available for review and download on GitHub.
- The public issues tracker is open to all who are ready to help us further improve our product.
- Public Build scripts allow you to compile custom binaries with the chart types you need.
- The open brancheslist demonstrates our development cycle and proves you can trust us.


Sharing
Now any chart can be shared on social networks with the help of the context menu. Properties specific to a particular social network can be set in the exports namespace.- Check out Sharing Charts in the Documentation.

Legend
In this release, we are glad to present several major legend features.- The itemsLayout() now supports new options that allow you to improve the legend's visual appearance, especially when multiple series are shown on a chart.
- The legend can now be placed inside a data plot (the positionMode() method) to facilitate a more efficient use of space on a chart.
- The drag() method is a pleasant addition to the preceding two features. It allows you to easily change the chart legend's position by simply dragging it throughout a chart.
- Check out Legend features in the Documentation.
Bug fixes:
- DVF-1747 — Map legend issues fixed.
- DVF-2323 — Map drilling issues fixed.
- DVF-2228 — Issues with map bounds fixed.
- SUP-706 Issue with legend marker in Column chart fixed.
- SUP-711 Issue with memory leak in StockChart fixed.
- DVF-1397 Fixed issue with title positioning.
- DVF-1829 Legend item issues fixed.
- DVF-2274 Legend sizing issue fixed.
- DVF-1449 Fixed issues with shared legend.
- DVF-2606 Legend item issue fixed.
- DVF-2318 Issues with series unhovering fixed.
- DVF-1746 Various minor legend issues fixed.
- DVF-2619 Downloading logo.png issues fixed.
- DVF-2637 Default timezone settings fixed.
AnyMap version 7.12.0
Released October 31, 2016
Localization Support
One of the main news of this release: support of localization using locale settings files and special formatting functions. You can switch between 196 different regional settings , and all date/time chart elements update themselves.- Check out Localization Support in the Documentation.

Map Grid (Meridians and Parallels)
Showing meridians and parallels on a map greatly improves its design and provides a clear view in visualizations where latitude and longitude do matter.- Take a look at Meridians and Parallels Grid in the Gallery.
- Check out Map Grid in the Documentation.

Map Axes
Map axes with latitude and longitude labels complement map grid showing meridians and parallels on a map. Geo Scale that controls Map Axes and grid allows to fine-tune the display and achieve a great variety of looks and feels for map visualizations.
Map Crosshair
Map Crosshair is a visual position tracking element, especially useful in exploratory data analysis visualizations. It works nicely in conjunction with Map Grid and Map Axes.- Take a look at Map Crosshair in the Gallery.
- Check out Map Crosshair in the Documentation.
AnyMap version 7.11.1
Released August 30, 2016Improvements:
- DVF-2119 — Legend width/height behavior improved.
- DVF-2362 — Scatter Series behaviour made consistent with other series.
- DVF-2261 — Credits behaviour improved.
- DVF-2346 — appendTheme() method added for easier management of themes.
- DVF-2079 — Beta version of the Data Adapter Module added for easier management of external files.
- DVF-2307 — Export Server can now return images as base64 strings or as shareable links.
Bug fixes:
- DVF-2352 — XML Schema validity problems fixed.
- DVF-2360 — Various minor Export Server issues fixed.
- DVF-2358 — Various minor Interactivity issues fixed.
- DVF-2376 — Inconsistent zIndex behaviour fixed.
- DVF-2338 — Various XML serialization/deserialization fixed.
- DVF-2337 — Various JSON serialization/deserialization fixed.
- DVF-2327 — toXML() deserialization method no longer adds unnecessary data into XML.
- DVF-1865 — remove() method problems fixed.
AnyMap version 7.11.0
Released Jul 27, 2016
Seat Maps
Seat Maps is a new feature based on SVG Vector images, which simplifies the process of building interactive Airplane Seating Charts, Opera and Cinema Plans, or any other types of seat maps. It is also suitable for building interactive schemes of parks, malls, or virtually any other entities you can put into an SVG image.
Map Label Positioning Improvements
We have added a lot of features to improve visual appearance of geographical maps. Learn more about Map Label Positioning Improvements >>- Take a look at Map Label Positioning Improvements in the Gallery.
- Take a look at Overlap Control in the API.
- Take a look at Callout in the Gallery.

TopoJSON format support
AnyMap now supports loading Geo Data in TopoJSON format. Geographical data files in TopoJSON format are much smaller (up to 10 times), so using TopoJSON instead of GeoJSON allows to reduce map rendering and page loading time.- Take a look at TopoJSON format support in the Gallery.
- Check out TopoJSON Maps in the Documentation.

Ability to use SVG Images as Geo Data
AnyMap now supports loading Geo Data in SVG format. When GeoJSON and TopoJSON are not enough, you can turn to SVG and use it as a source of geographical data. This format may be quite useful if you want to edit a map in a simple vector editor or to create a map of an imaginary place, a road map, or a map with rivers or custom labels.- Take a look at Ability to use SVG Images as Geo Data in the Gallery.
- Check out SVG Maps in the Documentation.
Bug fixes:
- DVF-2243 — Fixed tooltip failed to be shown on mobile devices
- DVF-2245 — Fixed wrong name for Xinjiang region map.
- DVF-2265 — Fixed crashing in some circumstances when using a getDrilldownPath() in Maps.
- DVF-2266 — Fixed World map meta data for Cyprus U.N. Buffer Zone, N. Cyprus, Kosovo, and Somaliland.
AnyMap version 7.10.1
Released May 31, 2016Bug fixes:
- DVF-2170 — Solved compatibility issues between AnyChart UI and other AnyChart products.
- DVF-2017 — Solved compatibility issues with old versions of ExtJS (3.4 and less).
AnyMap version 7.10.0
Released Apr 27, 2016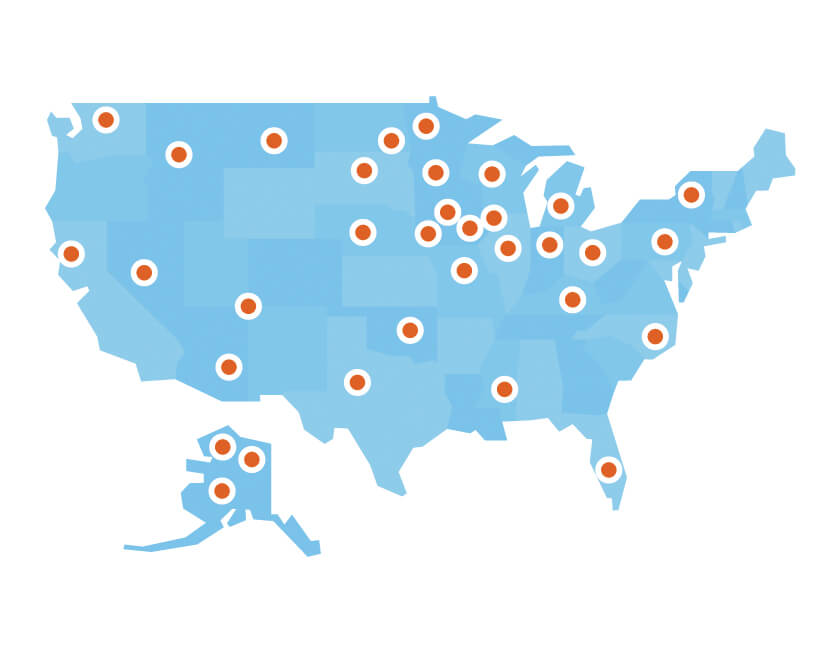
Dot (Points) Map
The Dot (Points) Map series type was added to AnyMap. It has the widest application range: showing cities, points of interest, events, creating density maps, and more. In the Dot Distribution Map (also known as Dot Density Map), a dot symbol shows the presence of a feature or phenomenon. Dot maps rely on visual scatters to demonstrate spatial patterns. With AnyMap, you can work with any of predefined marker types , code your own type, or use an image.- Take a look at Dot/Points Maps in the Gallery.
- Check out Dot/Points Maps in the Documentation.

Points Connections Map
The Point Connections Map series type was added to AnyMap. Points Connections Map can be used used to create Flight Maps, Route Maps, Demarcation Boundaries Map and in many other cases.- Take a look at Points Connection Maps in the Gallery.
- Check out Points Connection Maps in the Documentation.
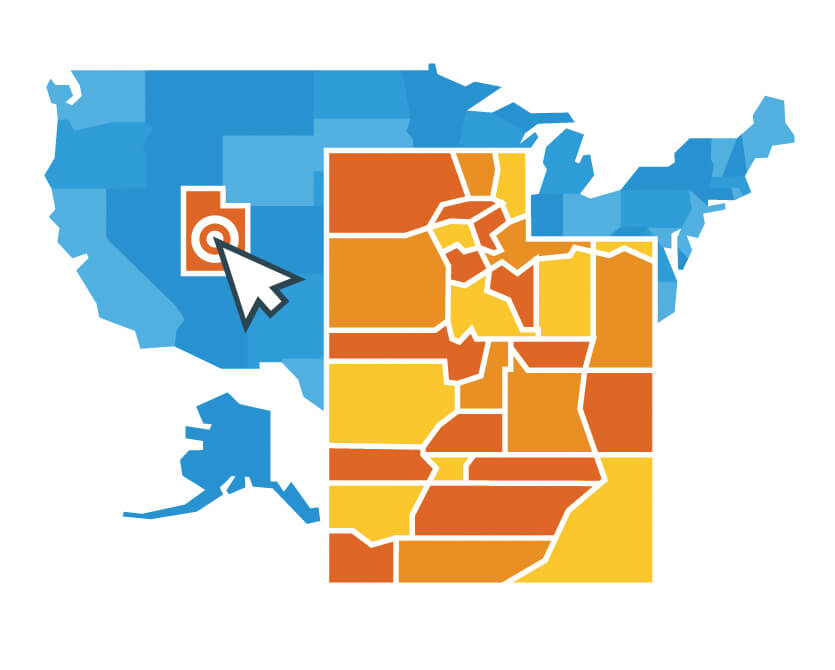
Drill Down Feature
Now you can change detalization level using the Drill Down feature. Source map settings can be preserved when you drill down, or completely reset if needed.- Take a look at Drill Down feature in the Gallery.
- Check out Drill Down feature in the Documentation.
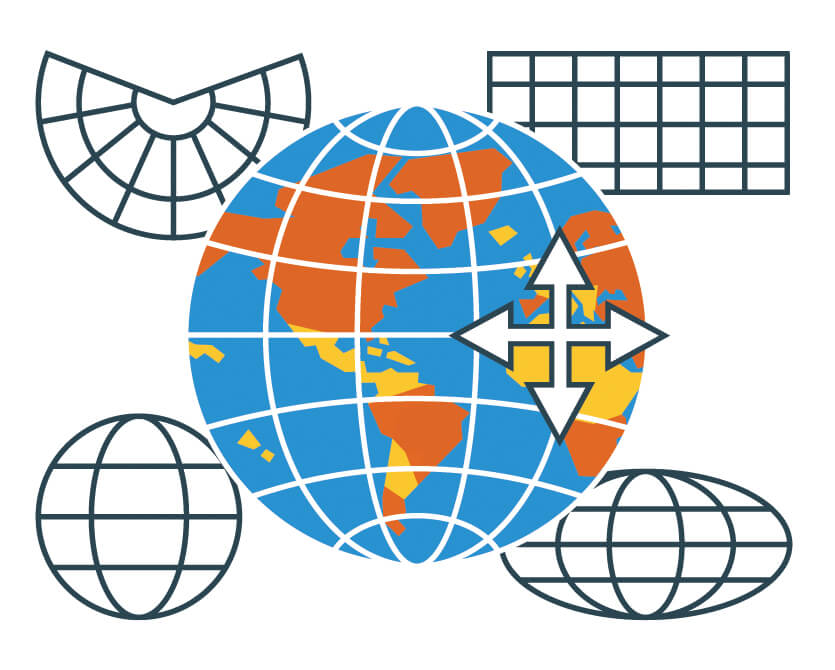
Common Maps Projections
Now you can show any map in one of the following projections: Aitoff, August, Bonne, Eckert1, Eckert3, Equirectangular, Fahey, Hammer, Mercator, Orthographic, Robinson, Wagner6, Wsg84, Please be careful when you change the projection — be aware of how map projections work and when it is appropriate to use them.- Take a look at Common Maps Projections in the Gallery.
- Check out Common Maps Projections in the Documentation.
AnyMap version 7.9.1
Released Feb 18, 2016Bug fixes:
- DVF-1975 — Solved issues with transformation from clientX/clientY to Lat/Long coordinates.
- DVF-1979 — Solved issues with PDF export function.
- DVF-1994 — Fixed bug with Lat/Long in Bubble Maps and Complex GeoData objects.
AnyMap version 7.9.0
Released Jan 27, 2016
Longitude/Latitude support
We have added an option to set coordinates (specify a location) of Bubbles in Bubble series in longitude and latitude degrees. New methods have been added to the API: the allow to convert mouse coordinates to longitude and latitude ( transform) and vice versa ( inverseTransform).- Take a look at the Bubble Gallery sample in the Gallery.
- Take a look at the Lat/Long API Gallery sample in the Gallery.
- Check out Longitude/Latitude support in the Documentation.
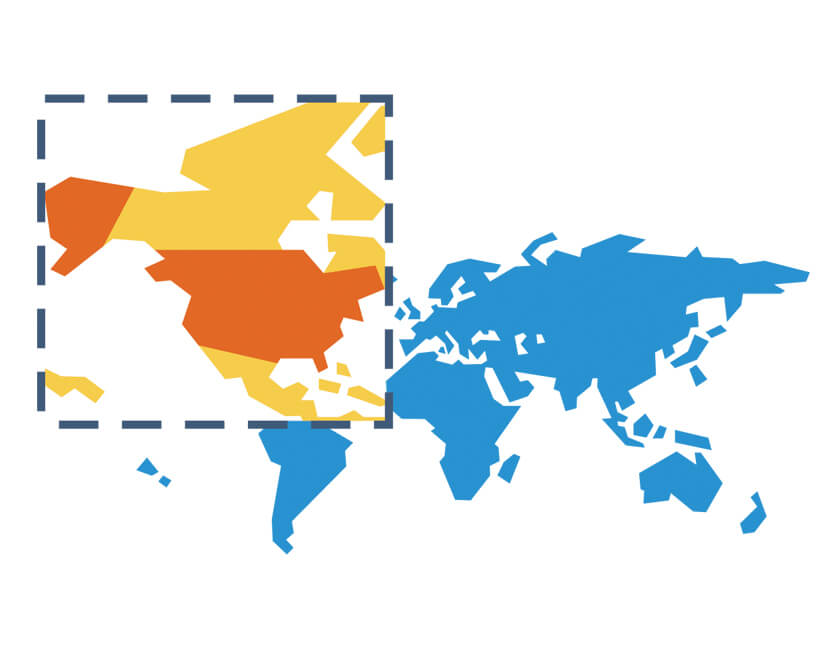
Move/Zoom API
Now there is a possibility to change the scale and move a map. An API for creating a custom UI (buttons, scrolls, etc.) has been added.- Take a look at the Gallery sample in the Gallery.
- Check out Move/Zoom API in the Documentation.

Rich Integration of Keyboard and Mouse Controls
Mouse integration- Mouse Wheel — Zoom a map
- Mouse Drag — Move a map (works only when the map is zoomed)
- Cmd/Ctrl + — Zoom in
- Cmd/Ctrl — - Zoom out
- Cmd/Ctrl 0 — Actual size
- Arrow up — Move up
- Arrow down — Move down
- Arrow left — Move left
- Arrow right — Move right
- Take a look at the Gallery sample in the Gallery.
- Check out the Integration Keyboard and Mouse Controls in the Documentation.
Map collection improvement:
We have added unique projections for more than 220 maps, which has significantly improved their appearance.Bug fixes:
- DVF-1757 — Fixed an issue with artifacts when the values in ColorRange was changing dynamically.
- DVF-1844 — Fixed an issue with the pointSelect event.
AnyMap version 7.8.0
Released Nov 3, 2015Improvements:
- DVF-410 — String, Date/Time and Number text formatting helper functions added.
- DVF-1731 — Event objects in Point listeners got improved structure and now easier to use.
- DVF-1760 — defaultSeriesType, addSeries, removeAllSeries, getSeries, getSeriesAt, removeSeries, removeSeriesAt, getSeriesCount methods added for easy series management.
AnyMap version 7.7.0
Released Sep 29, 2015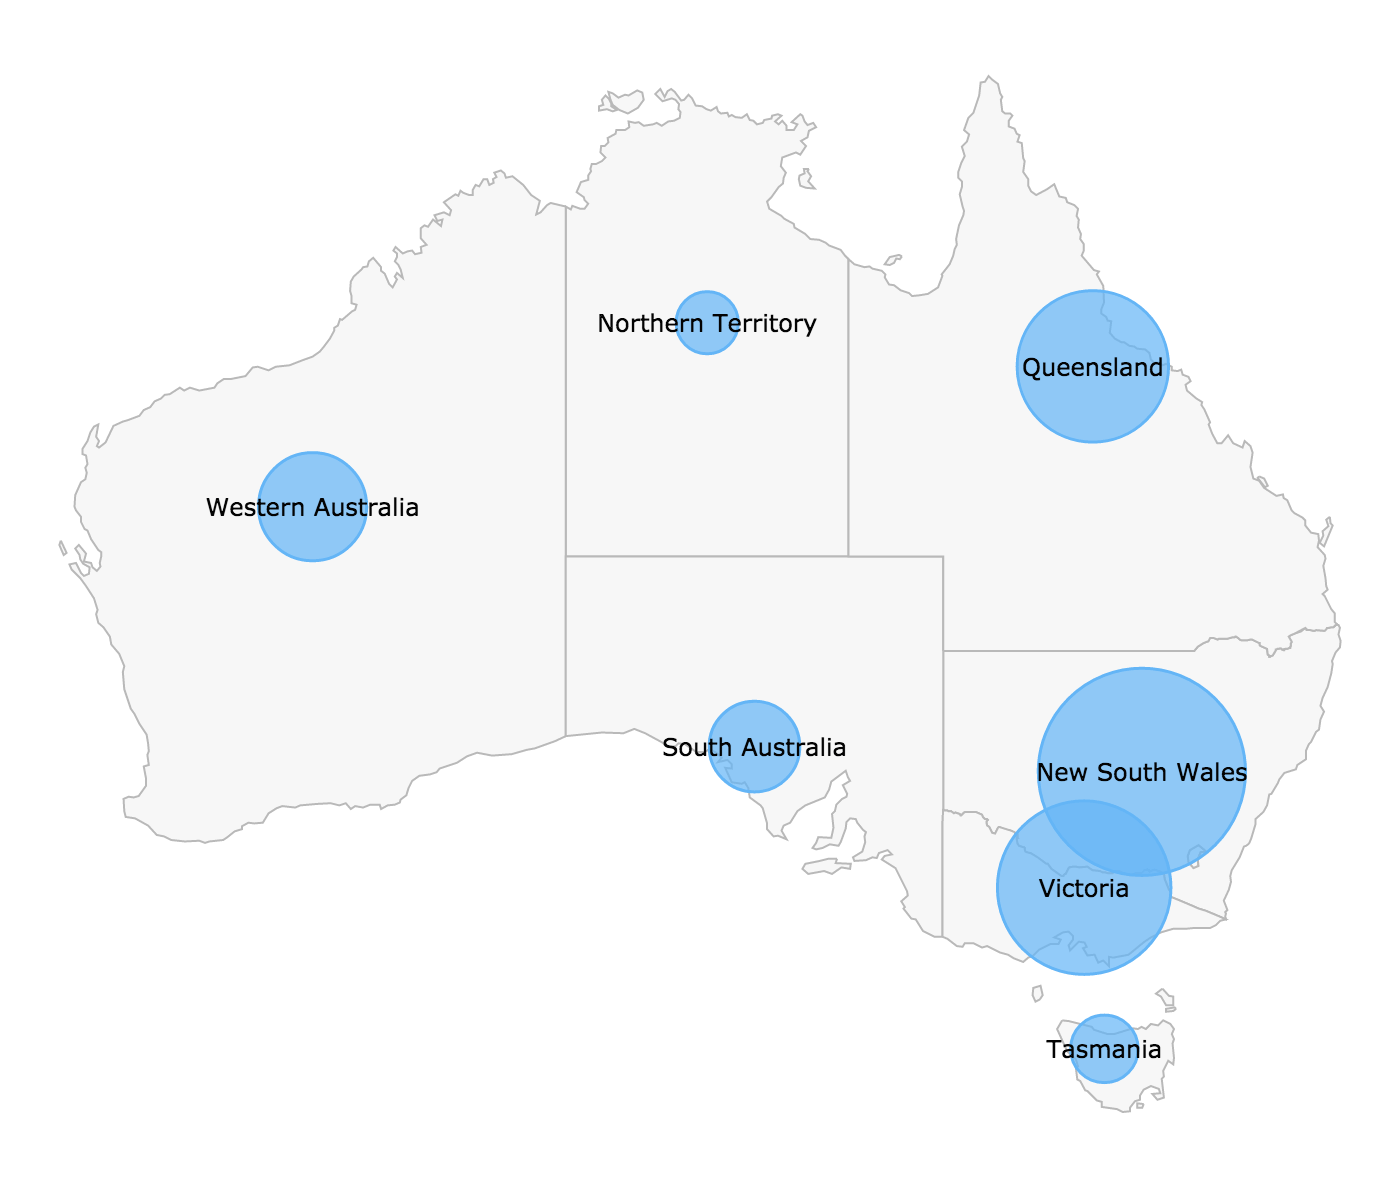
Bubble/Proportion Maps
Bubble/Proportion Chart series for Maps.- Take a look at Bubble/Proportion Maps in the Gallery.
- Check out Bubble/Proportion Maps in the Documentation.
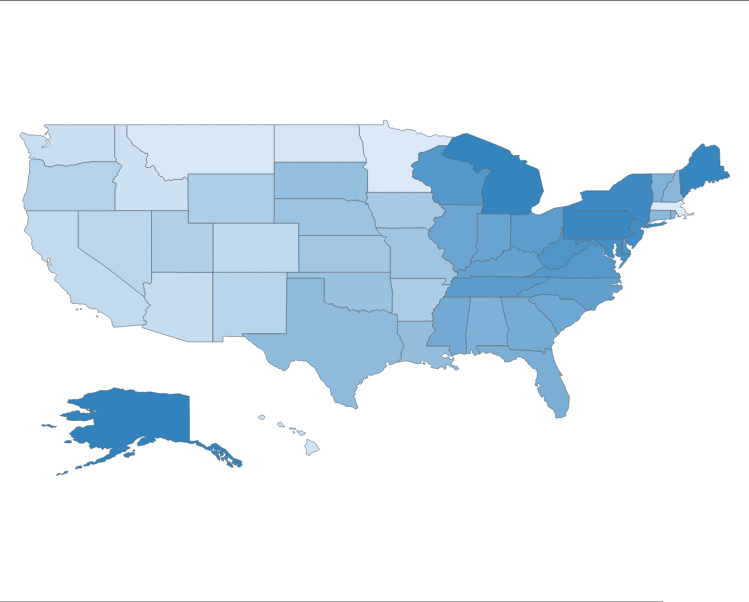
Maps Collection
More than 200 maps added into the maps collection.AnyMap version 7.6.0
Released Aug 3, 2015
Choropleth Maps
Choropleth Map is a thematic map in which areas are shaded or patterned in proportion to the measurement of the statistical variable being displayed on the map, such as population density or per-capita income.The choropleth maps provide the easy way to visualize how a measurement varies across a geographic area or it shows the level of variability within a region.
- Check out Choropleth Maps in the Documentation.
- Take a look at Choropleth Maps in the Gallery.
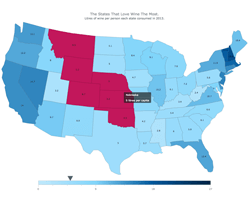
Interactivity
Set labels, fill, stroke and tooltips for the highlighted, selected or multi-selected (press and hold cmd/ctrl/shift) regions.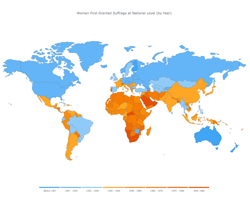
Ordinal Color Range
Ordinal Color Range looks like a number of boxes with different colors. Colors of these boxes depend on the palette chosen according to the type of map and its data.- Check out Ordinal Color Range in the Documentation.
- Take a look at Ordinal Color Range in the Gallery.
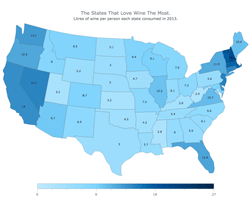
Quantitative Color Range
Quantitative Color Range looks like a single bar colored with a gradient, where its colors depend on a chosen palette.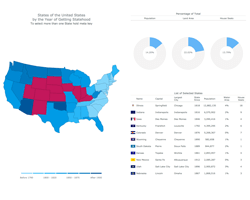
Full Compatibility with other Charts
If you need to show any extra information along with a map — no problem! Use Maps with any other of our Chart types. Use stage for positioning and working with layers, reuse datasets and more.- Check out Read Stage-Based Layout Article in the Documentation.
- Take a look at Full Compatibility with other Charts sample in the Gallery.