Warning!
We use cookies to ensure that we give you the best experience on our website. If you continue to use this site we will assume that you are happy with it. Read more about our
Privacy Policy
and
Cookie Policy
I agree
Vendas:
+1 (888) 845-1211 (EUA)
ou
+44 20 7193 9444 (Europa)
Português
日本語
Deutsch
العربية
汉语
Español
Русский
English
login de cliente
Toggle navigation
produtos
AnyChart
AnyStock
AnyMap
AnyGantt
Mobile
Qlik Extension
Recursos
Recursos
Soluções comerciais
Integrações técnicas
Chartopedia
Tutorials
Suporte
Empresa
Sobre nós
Clientes
Histórias de sucesso
Mais depoimentos
Notícias
baixar
comprar agora
Pesquisar
Automatic Coloring
Negative/positive colors, rising/falling colors, Color Scale with thresholds for series
Visão geral
Galeria de gráficos
Documentação
Roteiro
Histórico de versão
Chart Gallery
Automatic Coloring
Automatic Coloring
Select a theme:
Default
Dark Blue
Light Blue
Dark Earth
Light Earth
Dark Glamour
Light Glamour
Dark Provence
Light Provence
Dark Turquoise
Light Turquoise
Coffee
Monochrome
Morning
Pastel
Sea
Wines
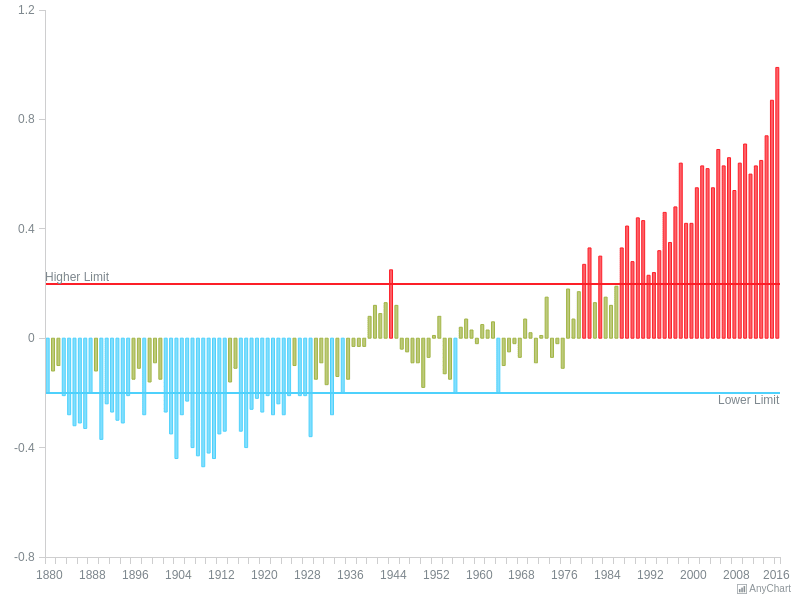
Automatic Series Coloring with color scales
Column chart, colored using a color scale. Values that exceed the upper limit are red, and values less than the lower limit are blue. Values between the two limits are colored green
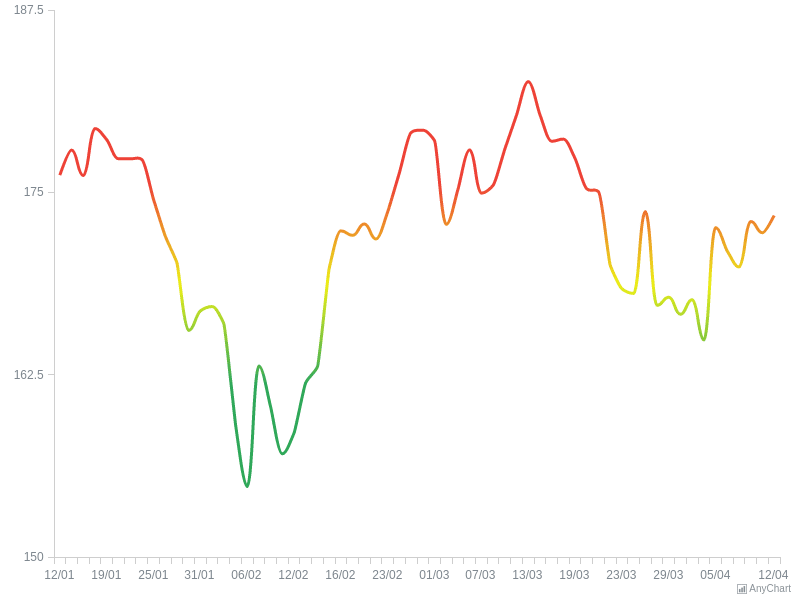
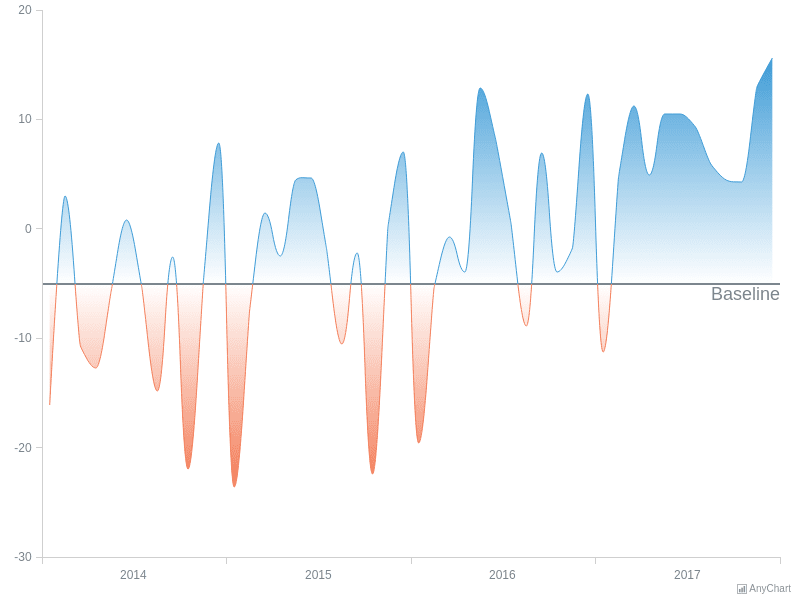
Gradient Scales Conditional Coloring
Spline chart, colored using a gradient with color keys offsets.
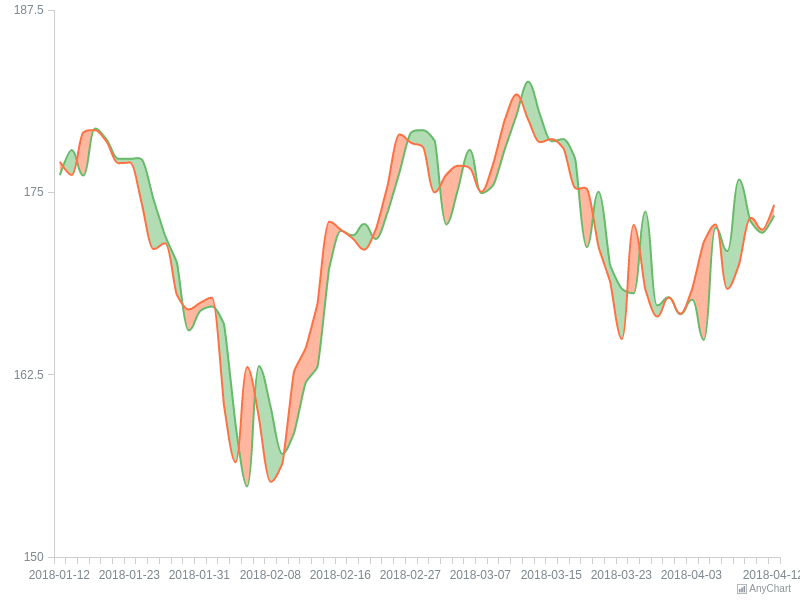
High/Low Fill Coloring
Range spline area chart, colored using high/low fill coloring. The fill is green if the high value greater than the low and it's red if vice versa.
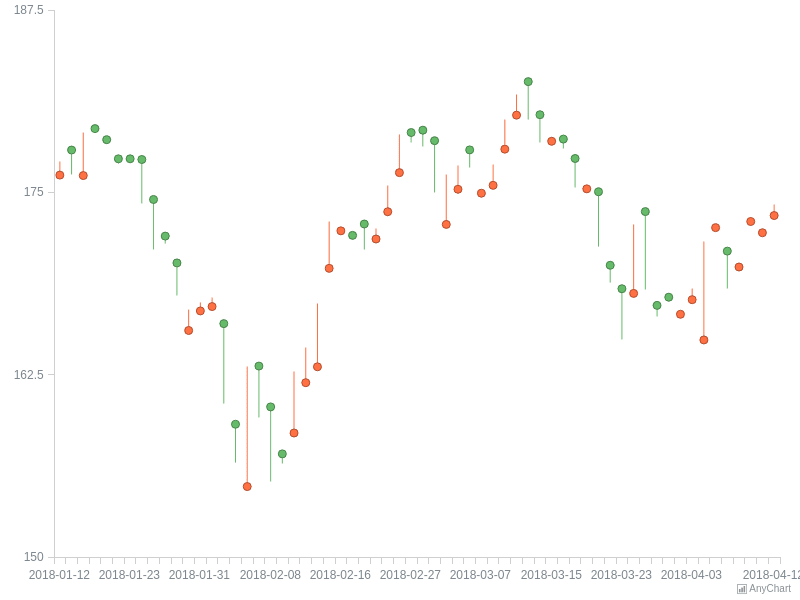
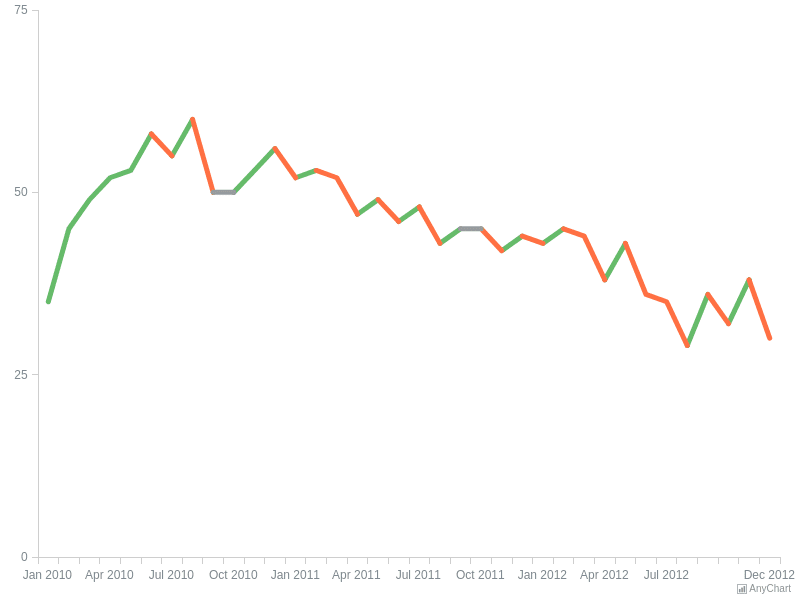
High/Low Stroke Coloring
HiLo chart, colored using high/low stroke coloring. If the value becomes higher - the stroke is green and the stroke is red if vice versa.
Negative/Positive Coloring
South African monthly Trade Balance numbers as published by the South African Revenue Service.
Rising/Falling Coloring