The very first version of AnyChart hit the shelves more than 10 years ago, check out what our products went through and see what's new in the most recent update.
Version 8.x History
AnyMap version 8.13.0
Released Sep 24, 2024Improvements:
- Minor improvements and map updates.
AnyMap version 8.12.1
Released Apr 11, 2024Bug fixes:
- DVF-4680 — Legend memory leak issue fixed
AnyMap version 8.12.0
Released Dec 4, 2023Improvements:
- DVF-4673 — Single select interactivity mode issue fixed
AnyMap version 8.11.1
Released May 10, 2023Improvements:
- DVF-4615 — Improved New York map
- DVF-4644 — Improved Ghana map
- DVF-4662 — Improved India map
AnyMap version 8.10.0
Released May 20, 2021Bug fixes:
- DVF-4513 — Update South Sudan and France meta-data
AnyMap version 8.9.0
Released Sep 29, 2020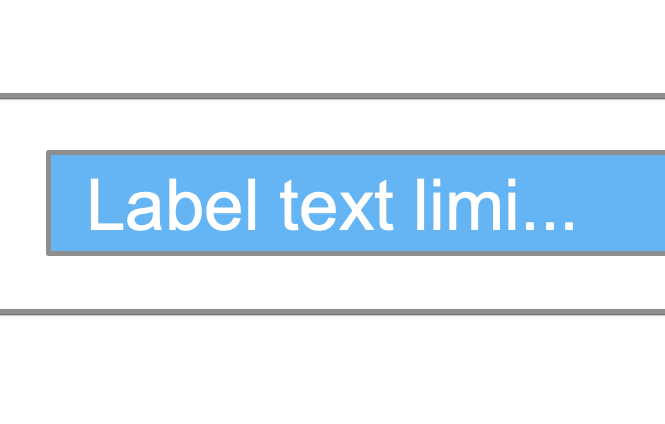
DVF-4373 — Labels text length
Added an option to limit the number of characters in labels for easier control over the chart display.- Take a look at maxLength() in the API.
DVF-4383 — Client-side CSV/XLSX export
CSV/XLSX can now be exported on client-side, without the help of an export server.Improvements:
- DVF-4403 — Cambodia map updated
- DVF-4029 — France and India maps updated. Puerto-Rico and New Zealand maps added.
Bug fixes:
- DVF-4429, DVF-4430 — Client side exports issues fixed
AnyMap version 8.8.0
Released May 22, 2020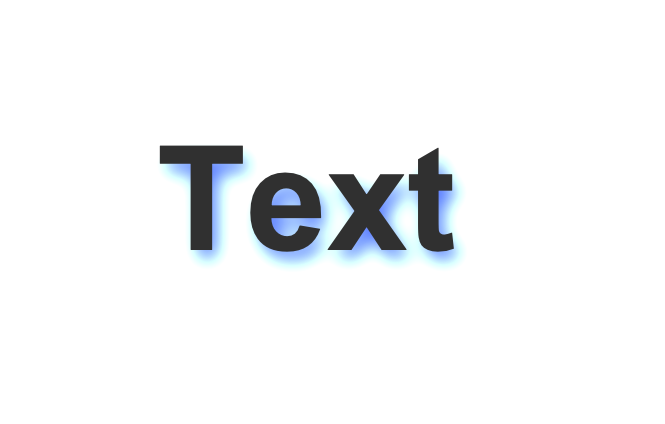
DVF-4386 — Text shadow effect
Most of the text elements got an option to tune text shadow with the textShadow() method.Shadow effect can help with text display on certain background colors or give your visualizations more wow-effect.
- Take a look at Wine Consumption Map of USA in the Gallery.
Improvements:
- The map of Cambodia has been updated to reflect the split of Kampong Cham province into two provinces: Kampong Cham (west of the Mekong River) and Tbong Khmum (east of the Mekong River).
AnyMap version 8.7.1
Released Dec 17, 2019Bug fixes:
- DVF-4315, DVF-4325 — Client-side export issue
- DVF-4319 — Hover cursor on legend
- DVF-4341 — Selection Marquee issue
Improvements:
- DVF-4320 — Disable credits over theme
AnyMap version 8.7.0
Released Aug 7, 2019
DVF-4247 — Client-Side Export
We've added the client-side export feature to all our JavaScript charting libraries - AnyChart, AnyStock, AnyGantt, and AnyMap. This will allow you to have your data visualizations saved as images (SVG, PNG, and JPG) and PDF documents without a roundtrip to the server, by leveraging the built-in browser features for a seamless JS chart export, fast and secure.
DVF-4278 — Polygonal Selection
We've made it possible to select points on JS map charts powered by the AnyMap library by drawing a polygon. In addition to the rectangular marquee, such a complex, polygonal selection can now be easily configured using our API and is also available to the end user from the context menu.- Take a look at Polygonal Selection in the Gallery.
Improvements:
- DVF-4277 — Legend. Add some icons support
Bug fixes:
- DVF-4201 — Legend issues
AnyMap version 8.6.0
Released May 15, 2019Improvements:
- DVF-3596 — AnyChart Locales Improved
- DVF-3597 — Custom Messages in locales
- DVF-4073 — Auto localized context menu from the included locale
- DVF-4178 — Hovered and selected features ordering issues fixed.
- DVF-4051 — Color Scale reworked - default range and “equal†flag are added.
Bug fixes:
- DVF-3944 — Resize event issues fixed.
- DVF-4187 — Charts disposing improved.
AnyMap version 8.5.0
Released Dec 24, 2018Bug fixes:
- DVF-3905, DVF-4101 — Andorra, Anguilla, Spain, Somalia, Singapour, Sierra Leone, San Marino, Brunei, Saint-Pierre, Dominica, Ghana, Hawaii, India, Nauru, Netherlands, Republic of Kongo, Liechtenstein, Jamaica, and USA maps fixes and improved.
- DVF-4063 — chart background issue fixed.
AnyMap version 8.4.2
Released Nov 23, 2018Bug fixes:
- DVF-4063 — Chart background zIndex issue
AnyMap version 8.4.1
Released Oct 30, 2018Bug fixes:
- DVF-3941 — Performance improvements.
AnyMap version 8.4.0
Released Oct 5, 2018
DVF-3857 — Performance issues
We have significantly improved the performance.Improvements:
- DVF-3873 — Improved rendering of legend.
Bug fixes:
- DVF-3655 — Fixed the issues with zooming in Firefox.
- DVF-3905 — The maps of several countries improved.
AnyMap version 8.3.0
Released Jul 10, 2018
HTML Tooltips Support
Tooltip customization is way easier now. Full support of HTML is available. You can write your own HTML code and customize tooltip visualization using CSS classes.- Take a look at HTML Tooltip in the Gallery.
- Check out HTML Tooltip in the Documentation.

Background Settings for Chart Data Bounds
The background can be changed for the data area if needed.- Take a look at Data Area Settings in the Gallery.
- Check out Background settings for chart data bounds in the Documentation.
Improvements:
- Color palettes improvements
- Labels background settings improvements
- Axis markers improvements (new methods: background, padding)
- Markers/Labels clipping improvements
Bug fixes:
- Color functions anychart.color.darken and anychart.color.lighten issues
- XML serialize scale ticks issue
- Escape/Unescape symbols in XML serialization
- hatchFillPalette now works correctly after drawing
AnyMap version 8.2.1
Released Apr 16, 2018Bug fixes:
- DVF-3038 — Aitoff projection display issues fixed.
AnyMap version 8.2.0
Released Mar 27, 2017
Crosshair Multiple Labels
Now you can display several crosshair labels on additional axes of the map.- Take a look at Crosshair Multiple Labels in the API.
AnyMap version 8.1.0
Released Dec 20, 2017Improvements:
- Changed minBubbleSize()/ maxBubbleSize() methods default values to make a better visual appearance of Bubble Maps.
- Improved memory allocation when running AnyChart in Node.js environment.
- String Tokens now auto-detect the type of formatting (string, number or DateTime) by token arguments. In addition, formatting types can now be defined directly using the type argument.
Bugfix:
- Fixed issues with Color Range labels formatting using String Tokens.
- Fixed Color Range errors occured in case of standalone usage.
- Fixed issues with extra small and extra large values formatting.
- Fixed issues with unicode symbols in String Tokens (desk case #3833, TS-415).
AnyMap version 8.0.0
Released Oct 2, 2017
Modular System
Modular System is the core of AnyChart 8. It allows you to significantly reduce the size of the JavaScript running on your web page by connecting only those chart types and features that you actually use. The modular based AnyChart is perfectly compatible with popular bundling tools such as Webpack, Browserify, and so on. Use our JS Builder to easily generate a custom build.- Check out Modular System in the Documentation.

Custom JavaScript Builds
Custom JavaScript Builder is designed for assembling a JavaScript file that contains only the features and chart types you are really going to use. The AnyMap version 8.0.0 contains 30 modules and 16 themes. You can also build a file that contains your license key .- Try Custom JavaScript Builder right now
- Check out Modular System in the Documentation.

Node.js Server-side Rendering
Node.js server is a lightweight web server that provides API for generating vector graphics (PDF, SVG, or PS), bitmap images (PNG, JPG, or TIFF), PDF reports, and data in CSV and XLSX (Excel). It uses the JavaScript code as well as JSON and XML configurations as input data. The server is very easy to install and customize, you can run it on any major platform: Linux, Windows, and macOS. It is ideal for creating report systems that send charts via email or social network sharing tools.- Take a look at Node.js Server API in the API.

No Data Label Feature
No Data Label Feature is an API designed to notify the chart viewer that data is not available. Data can be missing due to its absence by default or if it has been removed by means of the Data Updating API, Exclude Data Point feature, or through the interactivity.- Check out No Data Label in the Documentation.

CSV/Excel Export Reworked
By popular demand, we've remastered the algorithm for preparing CSV/Excel data for charts. Now it takes into account the chart type specific features and allows you to use multiple data sets for different series.- Check out Data Export in the Documentation.

Chart Export Settings
Now you can customize the export settings for each chart: links and descriptions for sharing on Facebook, image export options, and so on.- Take a look at Chart Export Settings in the API.
- Check out Chart Export Settings in the Documentation.
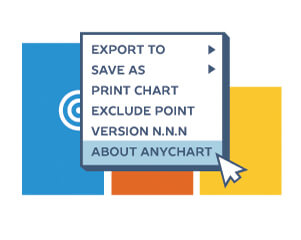
Context Menu Customization API
We've significantly simplified the process of the context menu customization. Now each item of the context menu is assigned with an ID that can be called to access the corresponding fields and settings as well as to add custom ones. We've also added the option to localize the context menu.- Check out Context Menu in the Documentation.
