Every day at AnyChart we deal with a lot of different data visualizations, charts, diagrams, dashboards when we help our clients to build their beautiful products. So, we have a lot of experience with both Flash and HTML5 charts, but also we recognize power of reading to get theoretical understanding of basic concept from guru-thinkers. Here are our top 5 picks:
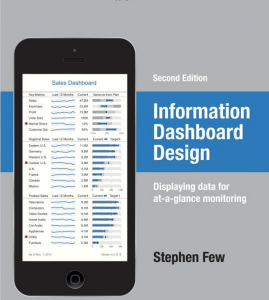 |
Information Dashboard Design: Displaying Data for At-a-Glance Monitoring by Stephen Few – probably the most used book in our library. A leader in the field of data visualization, Stephen Few exposes the common problems in dashboard design and describes its best practices in great detail and with a multitude of examples in this updated second edition. According to the author, dashboards have become a popular means to present critical information at a glance, yet few do so effectively. He purports that when designed well, dashboards engage the power of visual perception to communicate a dense collection of information efficiently and with exceptional clarity and that visual design skills that address the unique challenges of dashboards are not intuitive but rather learned. The book not only teaches how to design dashboards but also gives a deep understanding of the concepts—rooted in brain science—that explain the why behind the how. |
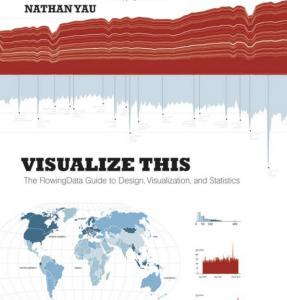 |
Visualize This: The FlowingData Guide to Design, Visualization, and Statistics by Nathan Yau – definitely beautiful and includes a lot of practical step-by-step advises.Data doesn’t decrease; it is ever-increasing and can be overwhelming to organize in a way that makes sense to its intended audience. Wouldn’t it be wonderful if we could actually visualize data in such a way that we could maximize its potential and tell a story in a clear, concise manner? Thanks to the creative genius of Nathan Yau, we can. With this full-color book, data visualization guru and author Nathan Yau uses step-by-step tutorials to show you how to visualize and tell stories with data. He explains how to gather, parse, and format data and then design high quality graphics that help you explore and present patterns, outliers, and relationships.
|
 |
The Wall Street Journal Guide to Information Graphics: The Dos and Don’ts of Presenting Data, Facts, and Figures by Dona M. Wong In today’s data-driven world, professionals need to know how to express themselves in the language of graphics effectively and eloquently. Yet information graphics is rarely taught in schools or is the focus of on-the-job training. Now, for the first time, Dona M. Wong, a student of the information graphics pioneer Edward Tufte, makes this material available for all of us. In this book, you will learn:
|
 |
Visual Insights: A Practical Guide to Making Sense of Data by Katy Börner and David E. PolleyIn the age of Big Data, the tools of information visualization offer us a macroscope to help us make sense of the avalanche of data available on every subject. This book offers a gentle introduction to the design of insightful information visualizations. It is the only book on the subject that teaches nonprogrammers how to use open code and open data to design insightful visualizations. Readers will learn to apply advanced data mining and visualization techniques to make sense of temporal, geospatial, topical, and network data. The book, developed for use in an information visualization MOOC, covers data analysis algorithms that enable extraction of patterns and trends in data, with chapters devoted to “when” (temporal data), “where” (geospatial data), “what” (topical data), and “with whom” (networks and trees); and to systems that drive research and development. |
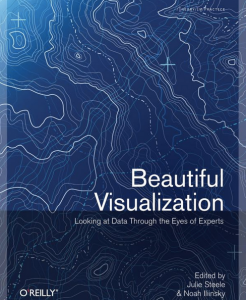 |
Beautiful Visualization: Looking at Data through the Eyes of Experts (Theory in Practice) by Julie Steele and Noah IliinskyVisualization is the graphic presentation of data — portrayals meant to reveal complex information at a glance. Think of the familiar map of the New York City subway system, or a diagram of the human brain. Successful visualizations are beautiful not only for their aesthetic design, but also for elegant layers of detail that efficiently generate insight and new understanding.This book examines the methods of two dozen visualization experts who approach their projects from a variety of perspectives — as artists, designers, commentators, scientists, analysts, statisticians, and more. Together they demonstrate how visualization can help us make sense of the world.
|
There are many other great books about data visualization. If you find a favorite missing, leave a response in comments!
To learn the basics of dataviz first, check out the Data Visualization 101 article with an introductory overview.
- Categories: AnyChart Charting Component, Books, Business Intelligence, Dashboards, HTML5, JavaScript, Tufte
- No Comments »