Today we are glad to publish a new customer success story – about AnyChart and Sparks & Associates.
 The Actualized Leadership Profile (ALP) is a 77-item self assessment that measures an individual’s dominant motive need and corresponding style of leadership. Based on the seminal works of Abraham Maslow and David McClelland, the ALP measures the degree of self-actualization that is demonstrated in one’s current style of leadership. A customized, full color and confidential report identifies the strengths and limitations in the individual’s current leadership approach.
The challenge was:
- To provide a creative and intuitive visualization of personal assessment results.
- To create a visualization that accepts result parameters from the system’s existing ASP code.
Solution:
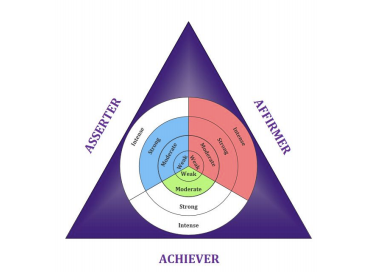
- AnyChart JavaScript (HTML5) component was chosen as a solution. The flexibility of the AnyChart.graphics technology allowed to nest several pie charts and create a multi-level JavaScript pie chart not available from other chart vendors.
- AnyChart provides the flexibility to use customized background visualizations.
You can enjoy the full success story here:
|
Sparks & Associates Sparks & Associates Chooses AnyChart to Visualize Assessment Results >> |
Or see other AnyChart Customer Success Stories.
- Categories: AnyChart Charting Component, HTML5, JavaScript, News, Success Stories
- No Comments »