In this post you will find a quick recap of the information on data visualization and AnyChart we have shared this week on AnyChart Facebook Page and Twitter:
- Kepler Orrery IV – This awesome data visualization is a new version of the Kepler Orrery animation. It shows all of the Kepler multi-planet systems on the same scale as the Solar System.
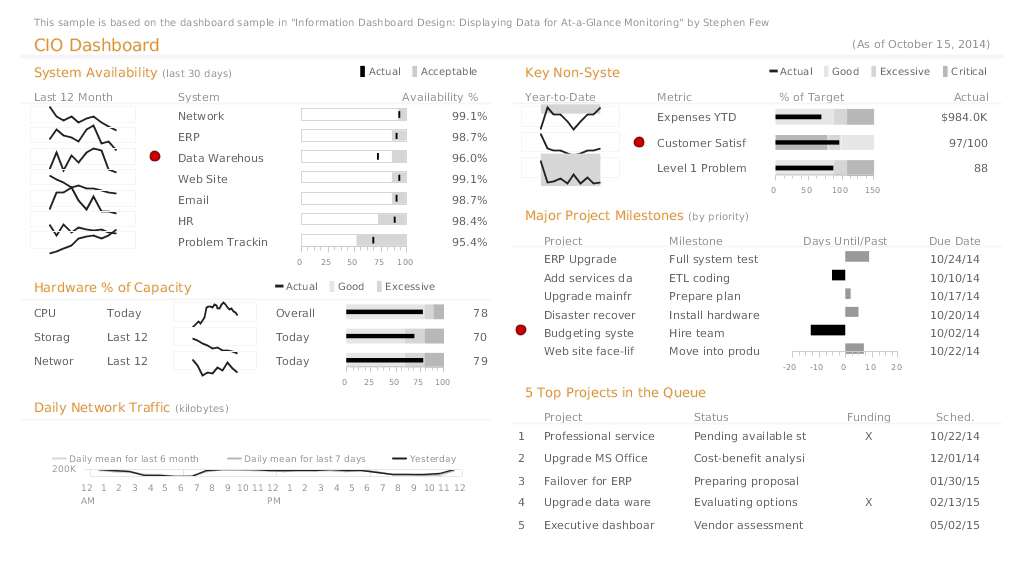
- CIO Dashboard – This complex JavaScript dashboard was created with AnyChart. Check it out in our sample gallery! (The dashboard is based on a sample from the book “Information Dashboard Design: Displaying Data for At-a-Glance Monitoring” by Stephen Few.)
- Tor Flow is a fascinating data visualization showing information flow in the Tor network – a group of volunteer-operated servers that allows people to improve their privacy and security on the Internet.
- GOP early debate: candidates ranked – a cool interactive visualization based on Google search.
- Categories: AnyChart Charting Component, HTML5, JavaScript, News
- No Comments »
