We are glad to introduce a new section of our site – AnyChart Business Dashboard Solutions. It is a series of sample dashboards demonstrating how our JavaScript Charts can be applied to various visualization tasks in various industries.
You can use AnyChart to visualize literally ANYTHING. Of course, our component is intended for reporting and data analysis in business applications in the first place, but we also provide AnyChart Graphics Framework allowing you to draw absolutely anything.
Here are the samples available at the moment:
Site Speed Dashboard
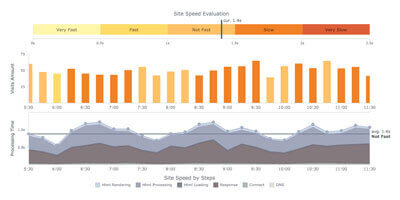 Nowadays every decent website admin panel has a web analytics tool with graphs, allowing an administrator to understand at a glance what is going on with a website and whether there are any problems. Site Speed Dashboard created with AnyChart JavaScript charting library combines simple chart types (Column, Bar, Line, Area) with less common Bullet charts to show web pages load speed, the number of visitors, and other parameters.
Please note that charts can be added even to tooltips: if you hover over the main column chart, you will see a small bar chart showing the list of the pages visited. This sample also demonstrates the possibility of real-time data streaming, which is very easy to implement in our flexible data architecture (for more information, see our documentation).
Sales Dashboard
 Reporting is a keystone when it comes to sales. A good manager knows everything about the sales situation, and this situation is not just a “Total” line in a daybook or a general ledger. One needs to know all the details of every bargain: what, where, when, who, to whom, and at what price. In the modern world, either you have this information, or you risk finding yourself at the bottom of the ladder very soon.
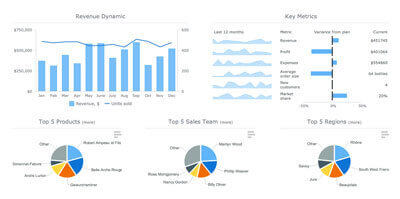
Wine Sales in France is a HTML5 dashboard based on the extensive usage of Bootstrap for creating tabs. The dashboard contains such chart types as Bar, Pie, Column&Line, Bullet, and Sparkline as well as Geo Maps from the standard set of AnyChart JavaScript charts library. Due to Bootstrap and AnyChart being cross-platform solutions, you will be able to see this dashboard on your smartphone or tablet. What is even more important is that a big data set can be presented in the form of small units, which allows one to grasp the situation and to come to a good decision quickly.
CIO Dashboard
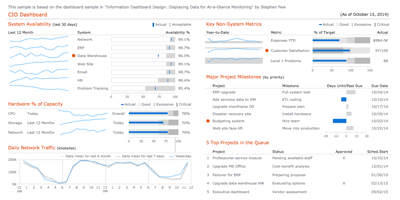 This sample is a tribute. It is a tribute to one of the great minds in modern data visualization – Stephen Few. His book “Information Dashboard Design: Displaying Data for At-a-Glance Monitoring” has been an inspiration for everyone at AnyChart – we have read it from cover to cover several times. It is hard to keep up with masterminds, but we try. We believe this dashboard shows that AnyChart JS charting library can be used to create visualizations that are clean, simple, compact, and easy to understand – “meaningfully see” as Stephen Few would say.
States of United States Dashboard
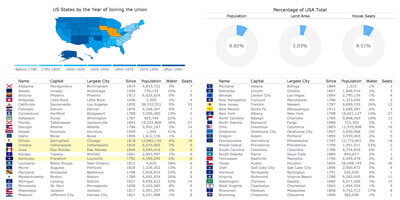
States of United States Dashboard is more of an infographic rather than a dashboard (though, of course, it is clear that there is a fine line between them, so it is a question of terminology). JavaScript Maps and pie charts are used in this solution to show the order of states joining the Union and to present some additional information such as the population and land area of a state and the number of seats in the House of Representatives it has. We are going to add more information to this dashboard and turn it into a real tool for learning the history of the United States.
AnyChart Bonfire
 As it was said in the beginning, AnyChart is not all about boring line and pie charts. You can use our component to visualize anything you want. For example, here you see that we drew an animated bonfire with the help of AnyChart Graphics Framework.
All the samples are distributed under an Apache 2.0 license, which means that you can use them from top to bottom, changing or not changing things. You can also fork them on GitHub, as well as pull requests and raise issues if you discover a bug or think the samples can be improved. We are looking forward to your feedback and collaboration!
Please do not forget about another new page on our site: the section of technical samples we wrote about earlier.
- Categories: AnyChart Charting Component, Business Intelligence, Dashboards, HTML5, Humor, JavaScript, News
- No Comments »
