Edward Tufte one-day course in San Francisco
Edward Tufte, which was once called “The Leonardo da Vinci of data”, is a statistician and artist, a professor emeritus of political science, statistics, and computer science at Yale University, and an author of 4 classic books on data visualization. In December 2015, Mr. Tufte read his one-day course in data visualization (Presenting Data and Information) in San Francisco. We were there and enjoyed it a lot! See our short report about this event, along with some photos we took during the lecture.


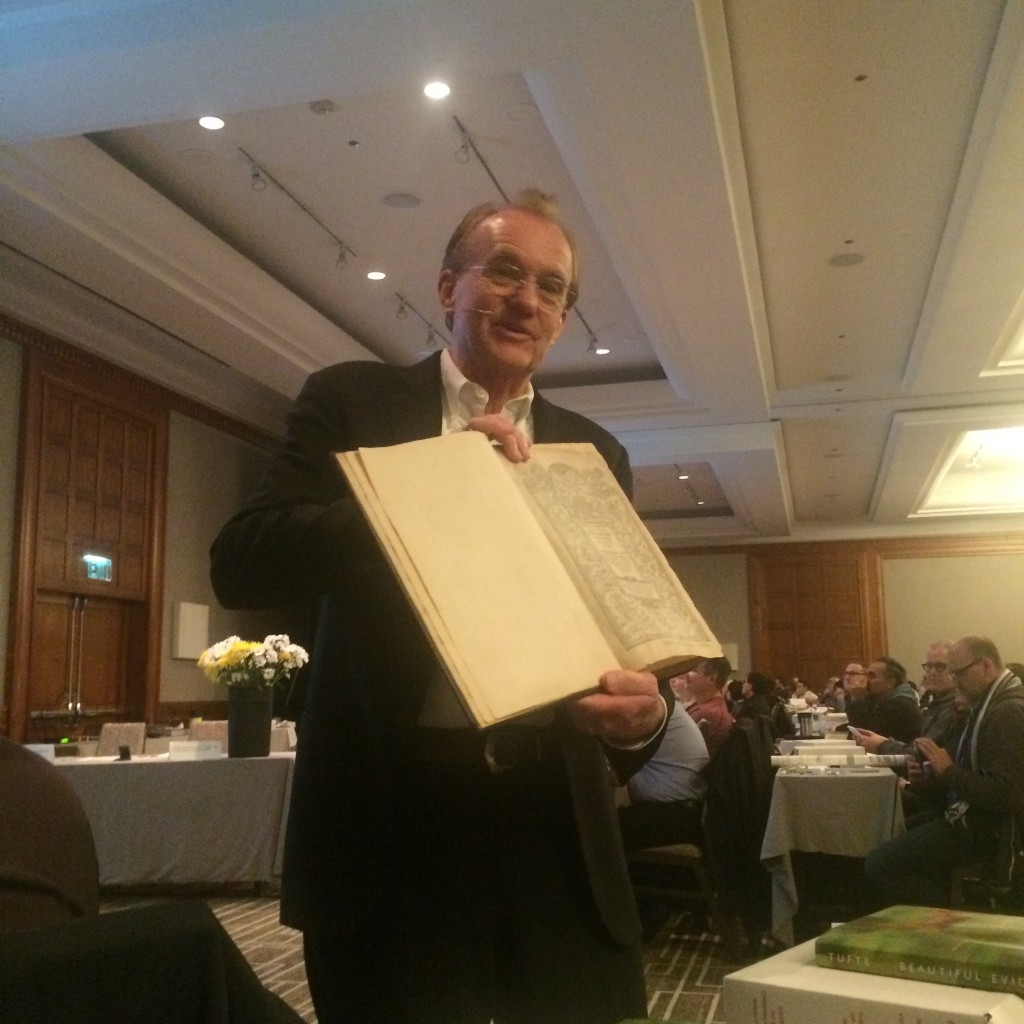
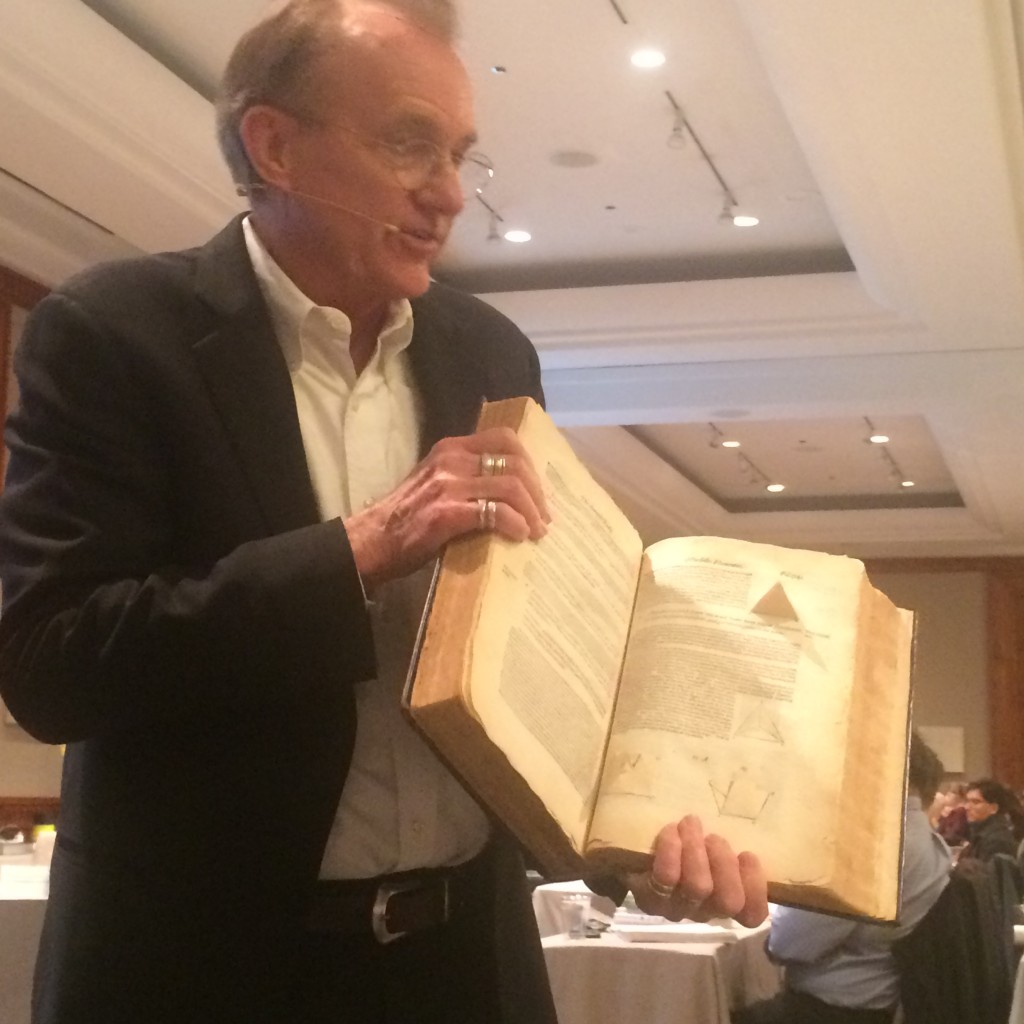
In this picture Edward Tufte shows a most remarkable book – Euclid’s Geometry (1570) with pop-up 3D models:

And here is an image of Russian army command center, which was used by Mr. Tufte to express his disapproval of 3D Pie charts. He said that a country that uses 3D Pie charts in its’ command center will lose any war. However, we believe that, if used properly, 3D Charts can be a decent tool for data visualization – that is why we have added them in AnyChart JavaScript Charts Library.

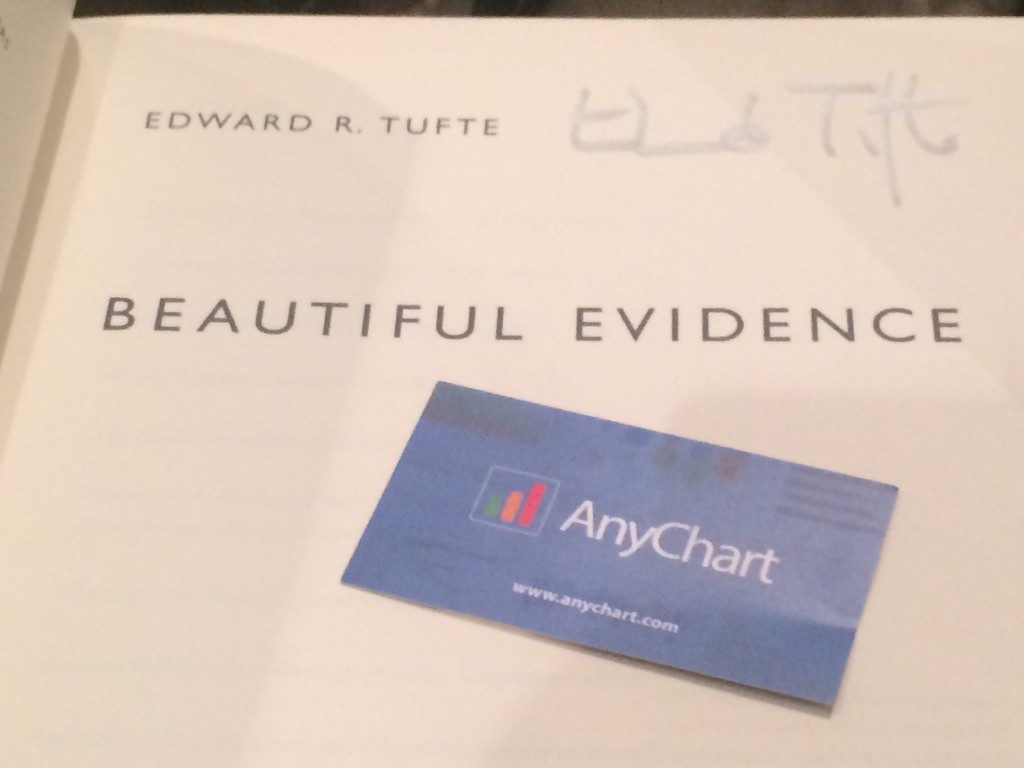
After the lecture, we were lucky to get our books signed by the author and talk to him. Mr. Tufte remembered us because AnyChart implemented Sparkline Charts – a type of charts he invented. He suggested that we use AnyChart to create some of the challenging data visualizations mentioned in his books. Challenge accepted, coming soon!
Our short but intensive conversation with Mr. Tufte was followed by discussing Sparklines in Twitter:
@EdwardTufte Thank you for very interesting day-a lot to think about! You've asked about our sparklines – https://t.co/G0VwY308NZ Thank you!
— AnyChart (@AnyChart) December 17, 2015
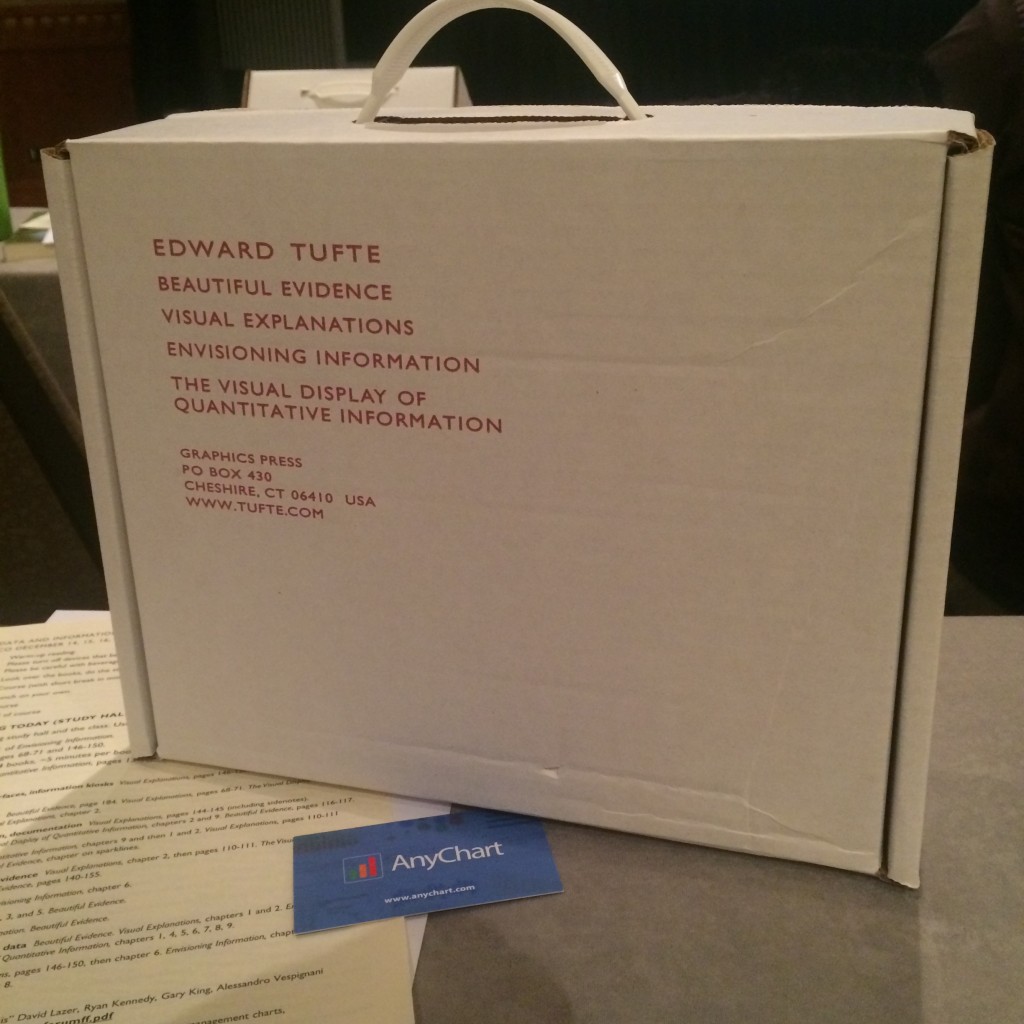
So we ended up getting a boxed set of four books: Beautiful Evidence, Visual Explanations: Images and Quantities, Evidence and Narrative, Envisioning Information, and The Visual Display of Quantitative Information.

- Categories: AnyChart Charting Component, News, Tufte
- No Comments »