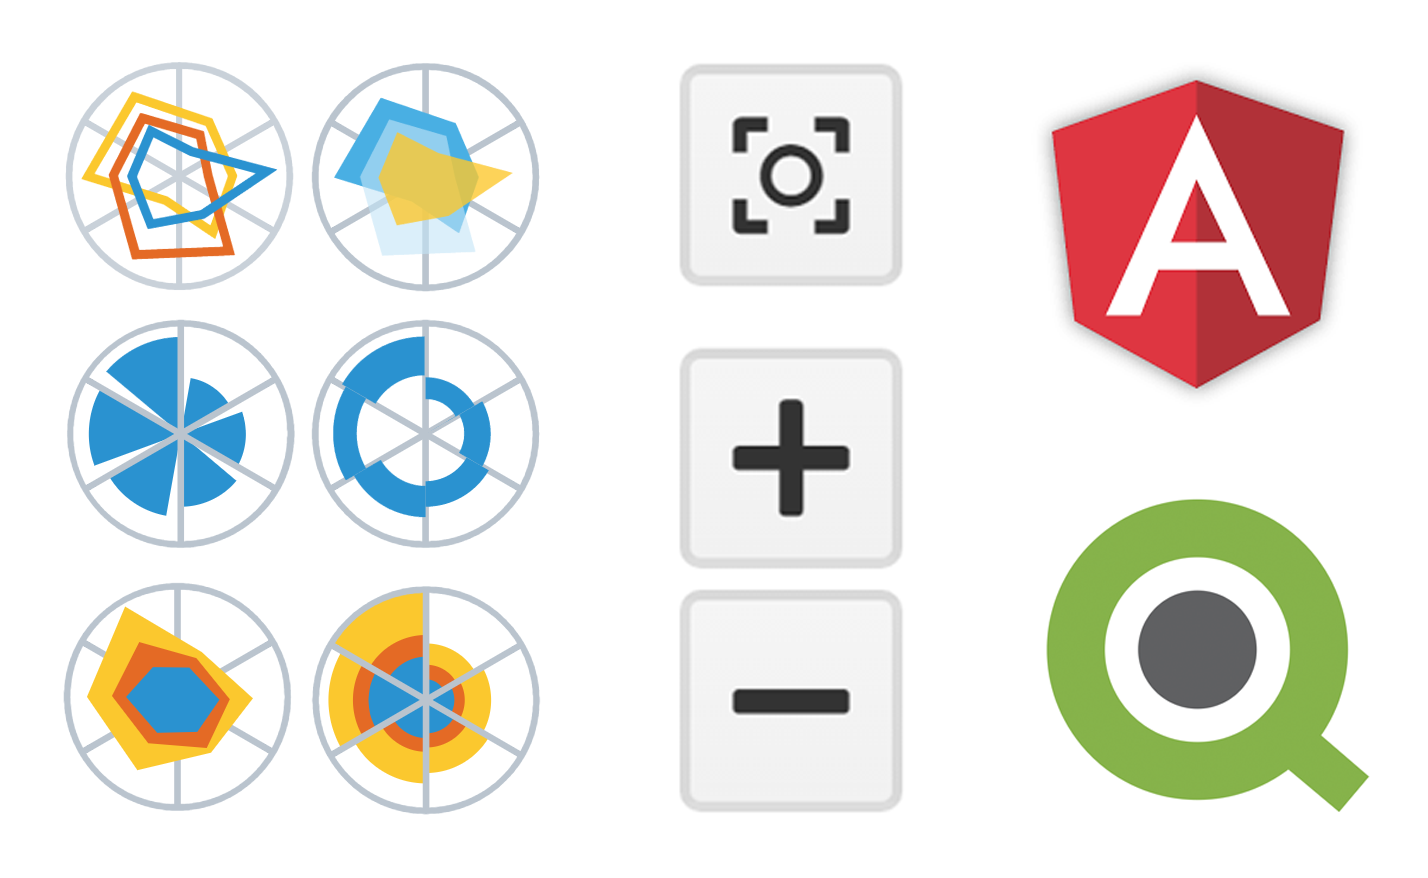
 “Sweet April showers do spring May flowers,” once wrote 16th-century English poet Thomas Tusser. Well, our customers already know that AnyChart’s April brings flowers, too! Last year we launched the great 7.10.0 version of the AnyChart JavaScript charts library and, basically, of our whole data visualization product family. Now, in the year of 2017, April brings you another great update.
So, please all greet the 7.13.1 release of AnyChart, AnyMap, AnyStock, and AnyGantt – our cute first spring flowers grown especially for you!
What’s New in AnyChart JavaScript Charts Library (+ AnyMap, AnyStock, AnyGantt)
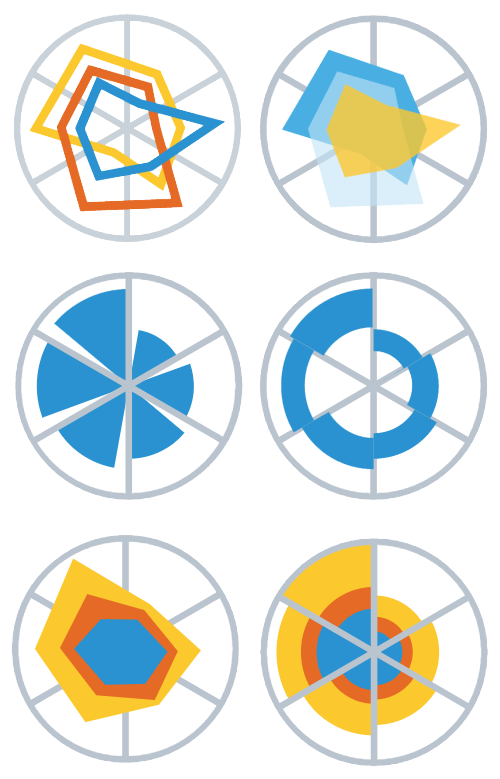 |
New Polar Chart Types We significantly extended the opportunities of the Polar chart type and added the following six new JavaScript (HTML5) charting features that will allow you to make stunning interactive visualizations of your data in the new format: |
 |
Angular 2 Plugin To further facilitate integration of our JavaScript charts libraries AnyChart, AnyMap, AnyGantt, and AnyStock, we are happy to introduce two more plugins in addition to those published within the framework of the 7.13.0 release. The first one is – AngularJS v2.x directives. |
 |
Qlik Plugin The second plugin we’ve just released is the Extension for Qlik Sense, a well-known platform for data analytics. Now you can quickly create wonderful JavaScript (HTML5) charts in Qlik Sense with the help of the AnyChart JavaScript charts library. All chart types supported in AnyStock, AnyMap and AnyGantt libraries will be available in Qlik Sense very soon. |
 |
Zoom Controls in JS Maps Also, we’ve added Zoom Controls to enhance the UI of interactive JavaScript (HTML5) maps you create with the AnyMap library. In fact, now there are three buttons available: Zoom All, Zoom In, and Zoom Out. You can add them using the new zoom() method. Please take a look at the docs article and our new gallery samples to learn more. |
Refined JavaScript Charts: Here’s Even More!
And that’s not it yet! Here are even more of great innovations that have come with the 7.13.1 release.
1. We’ve improved data labels in the AnyChart JavaScript charts library and in the AnyMap JavaScript maps library. To put it baldly, we’ve done a great, really big job to let you work with our charting components even more easily, conveniently, and intuitively. In particular, now you are welcome to enjoy the following updates:
- Data label settings for all of the available chart series can be set using just one single method – chart.labels.
- All formatting functions now have a unified context object (see anychart.format.Context for details).
2. Another big deal is the TypeScript support. Now you can use AnyChart, AnyMap, AnyGantt, and AnyStock in your TypeScript projects as we’ve made a definition file for our JavaScript charts libraries! You can find it in the distribution folder on GitHub.
And that’s still not all! Actually, we’ve done even more improvements as well as bug fixes and some relieving changes to the API. We hope you’ll make sure that you are aware of everything that’s been added and enhanced. As always, you can see the lists of all the changes in the version history of your favorite JavaScript charts library, whether it’s AnyChart, AnyStock, AnyMap, or AnyGantt.
What’s Next?
Hoping we’ve made you happy this April with the 7.13.1 release, we are also glad to remind: May will bring even more flowers as the next, 7.14.0 major update of the AnyChart JavaScript charts library (as well as of AnyMap, AnyStock, and AnyGantt – follow these links to go to their roadmaps) is coming! Cheers, and thanks for being with us!
- Categories: AnyChart Charting Component, AnyGantt, AnyMap, AnyStock, HTML5, JavaScript, News, Qlik
- 2 Comments »