 Achieving and maintaining effective Project Management is one of the most important challenges for every company. And high-quality visualization of resource usage and activity processes is a great tool for significantly improving the overall performance of a project. Keeping that in mind, we cannot omit the information on how to properly represent projects and resource data.
Read this article to learn what (specific) chart types you can choose to use in such cases.
List of Chart Types for Better Managing Projects and Resources
To start with, here’s a quick list of specific chart types that people widely use for planning, scheduling and monitoring project and resource activities, occupation, etc.:
- Project Gantt charts;
- Resource charts.
As is already standard for this Choose Right Chart Type for Data Visualization series of articles, now let’s dig into their purposes and real-world use cases.
Choosing Charts for Resource and Project Management
Project Gantt Chart
Successful project management is impossible without understanding relationships between various projects and in-project activities. When implementing a project, the Gantt chart type is used to hierarchically identify tasks, assigning a time and resource to each step in the process.
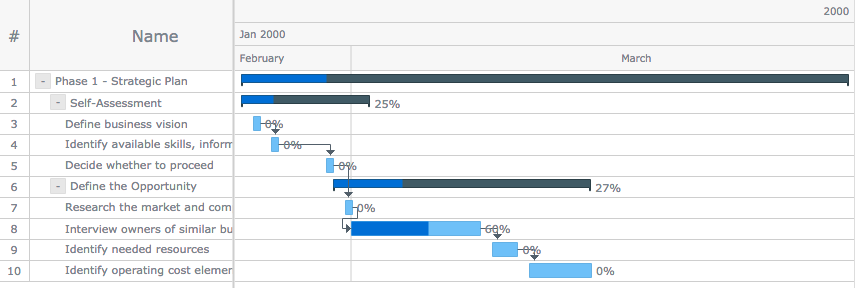
Gantt charts typically display horizontal bars, representing the time period required for each task and the percentage completion rate at any point in time.
For example: project activity chart.
Additional examples include: planned vs. actual progress of projects, etc. Take a look at more Project Gantt chart examples in this gallery.
Resource Chart
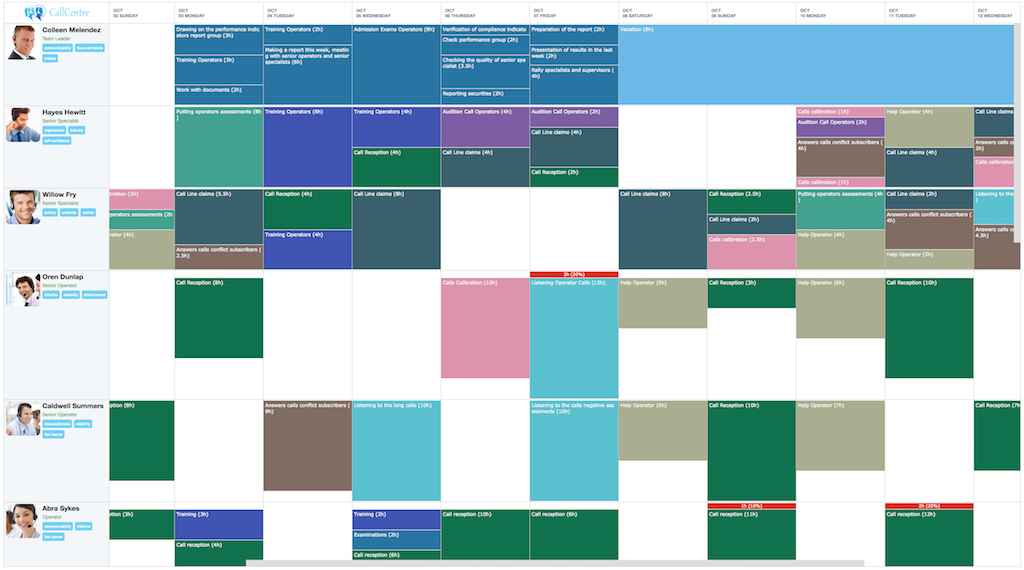
To ensure the effective distribution of resources across tasks by visualizing occupation time for each resource, the Resource chart type is used. It significantly facilitates observing periods of time when a resource is available or not. In this type of chart, each resource is depicted as a horizontal bar along a time-based axis.
For example: sales call center resources.
Additional examples include: human resources at work, server status, etc. Take a look at more Resource chart examples in this gallery.
Conclusion
Now you know what chart types are useful in project management as well as resource monitoring, planning, and scheduling. You can choose a Gantt chart or a Resource chart respectively as these types generally are optimal solutions when it comes to visualization of the corresponding data.
When choosing what chart type to use, always mind your data and questions you have. Chartopedia will give you an idea of other choices in different situations if you see the need. There you can look up a certain chart type that you are interested to learn more about or use filters by purpose of use to go from there.
After deciding on the chart type, head to our Chart Docs and API Reference to quickly learn how to code it in JavaScript (HTML5).
Still in doubt about chart types? Ask you questions in the comments. We’ll be glad to be of help!
- Categories: Choosing Chart Type, Tips and Tricks
- 1 Comment »

