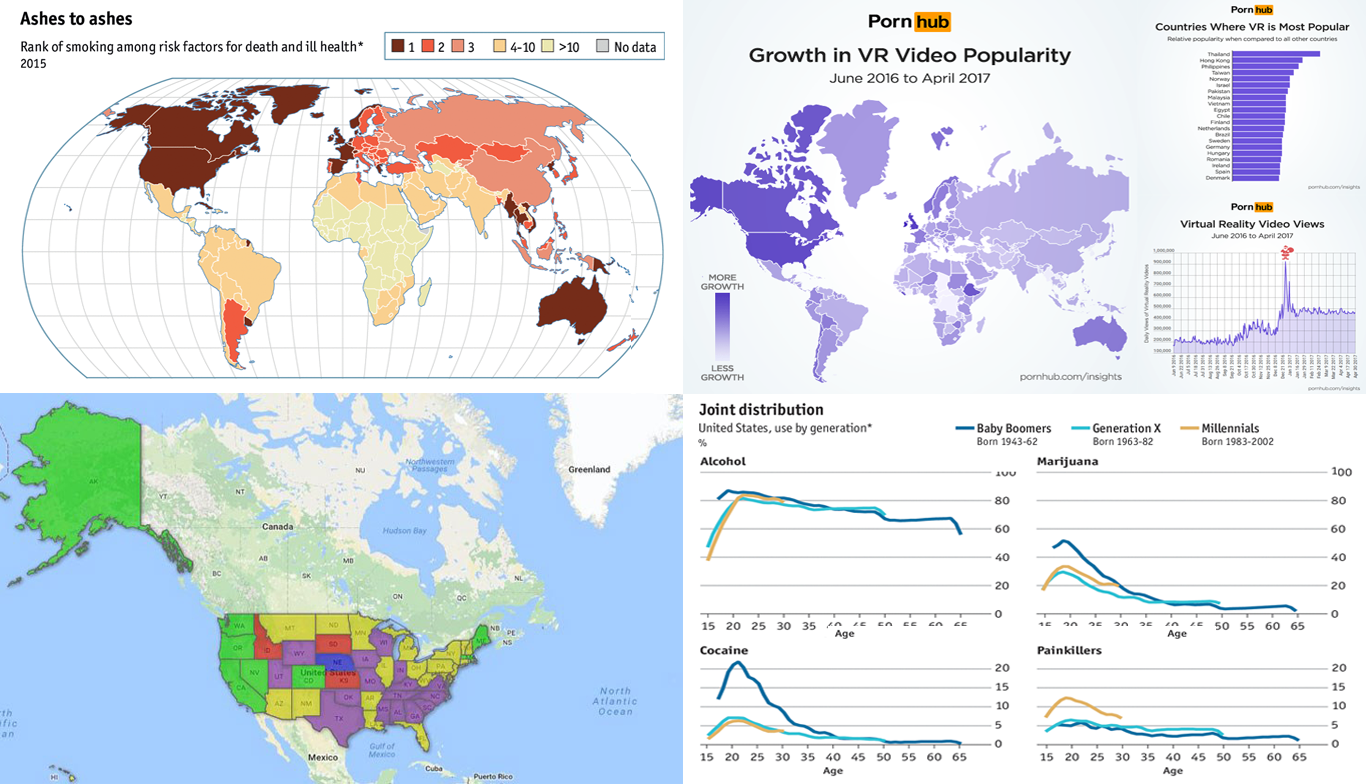
 Weekly digests of cool data visualizations have become a wonderful tradition on our blog. This time, we’ve highlighted charts and maps that graphically represent peculiar data about drugs and porn. Here you’ll find visualizations recently shared on The Economist, Forbes, and Cannabis Business Times. They are about:
- Pornhub insights on VR videos,
- drug use in the US by generation,
- interactive map of marijuana legislation in the US, and
- map of smoking as a risk factor for death and ill health.
So, let’s take a look at them now.
New Cool Data Visualizations in DataViz Weekly: June 23, 2017 – June 30, 2017
Virtual Reality Porn Data: Pornhub Insights
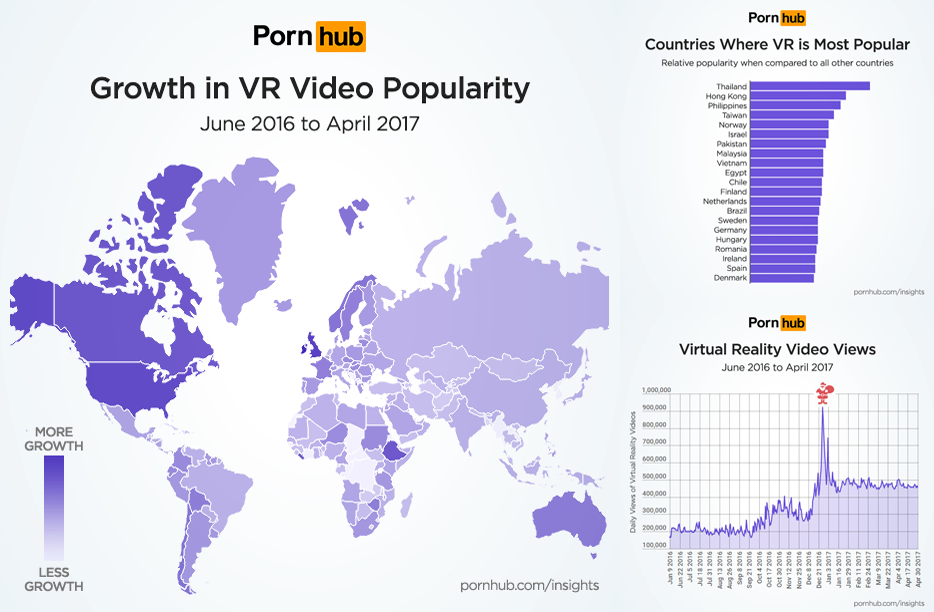
Pornhub reports Virtual Reality to be among the fastest growing video categories. According to the website’s statistics inquired by Forbes, VR porn is relatively most popular in Thailand, and it has grown by 250% in the United Kingdom and the Republic of Ireland over the last year, which is the highest rate worldwide. Pornhub data also says that the biggest number of VR video views in the United States comes from California, but New Jersey, New Hampshire, Rhode Island and Vermont are approaching fast. See the official Pornhub insights report if you’d like to learn more and see all the chart and infographic visualizations on this subject.
Visualization of US Drug Use Data by Generation
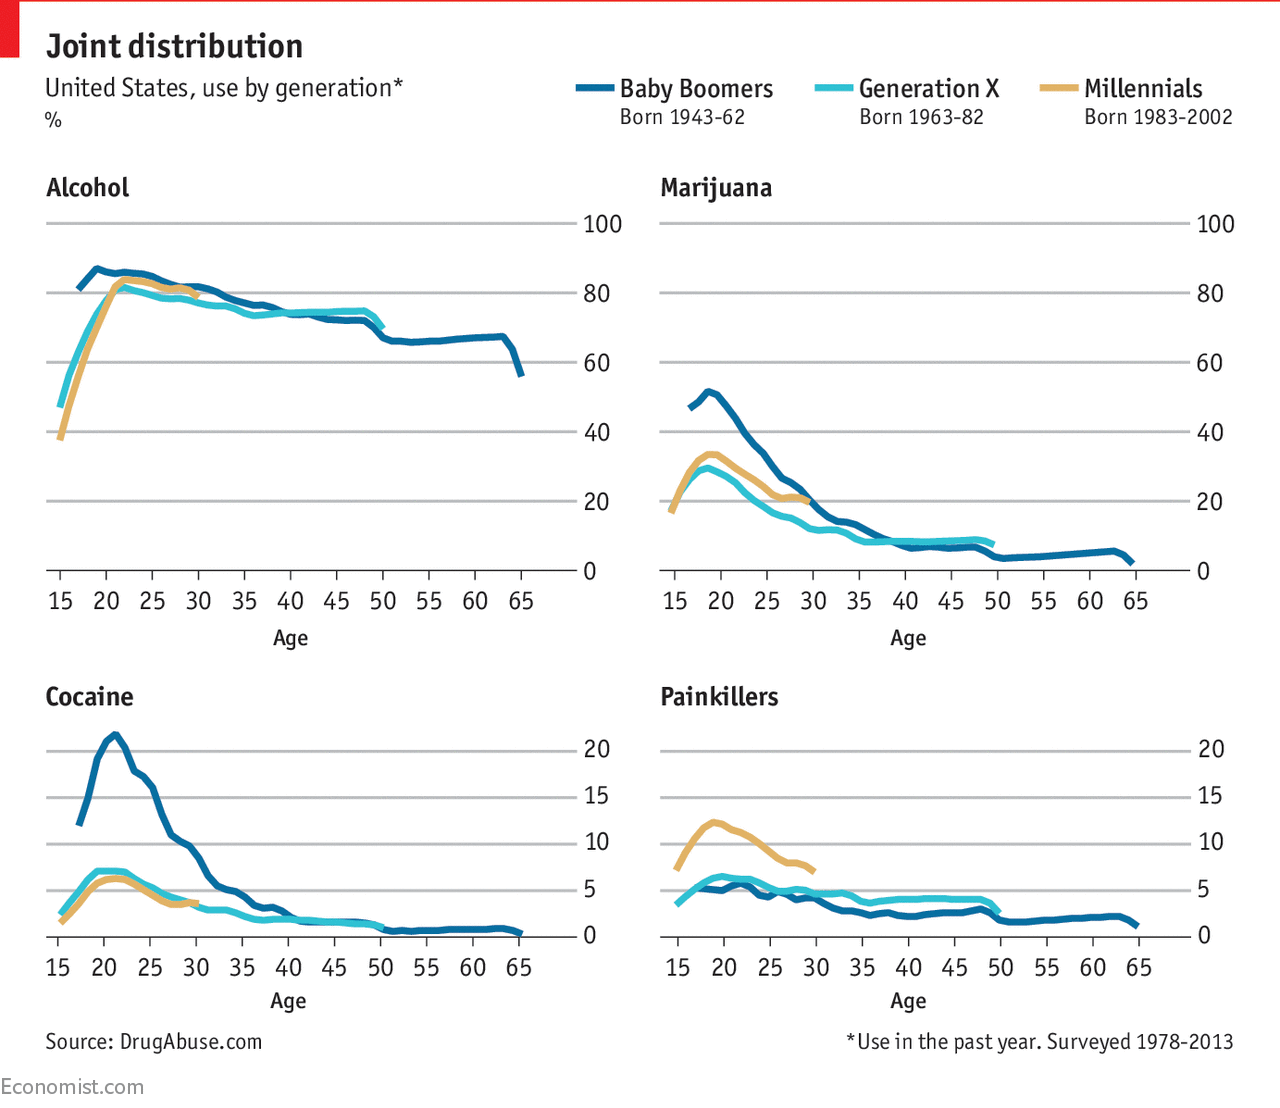
The Economist visualized data from DrugAbuse.com to compare drug use patterns of Baby Boomers, Generation X, and Millennials in the United States. These charts show some peculiar differences. In particular, people that were born between the years of 1982 and 2002 (i.e. Millennials) consume less cocaine and marijuana than those born between 1943 and 1962 (i.e. Baby Boomers) did at the same age.
Interactive Map of Marijuana Legislation Across States
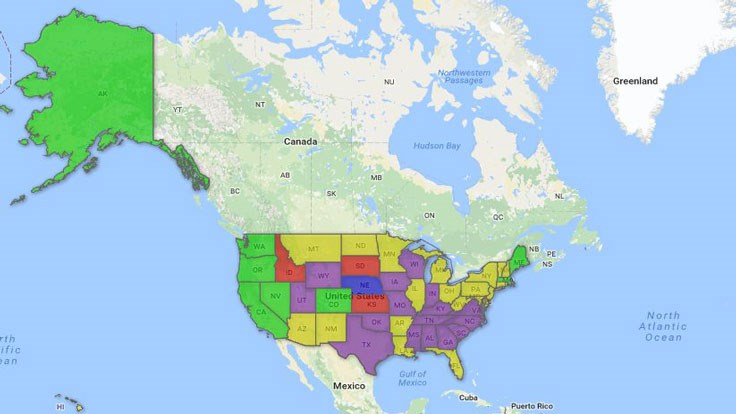
Cannabis Business Times published an updated interactive map of the United States that displays legality of marijuana in each state. It should help cultivators of cannabis keep up with the legislative landscape across the country. The authors promise to continue tracking all changes in this field and push timely updates to this data visualization.
Countries by Rank of Smoking Among Risk Factors for Death and Ill Health
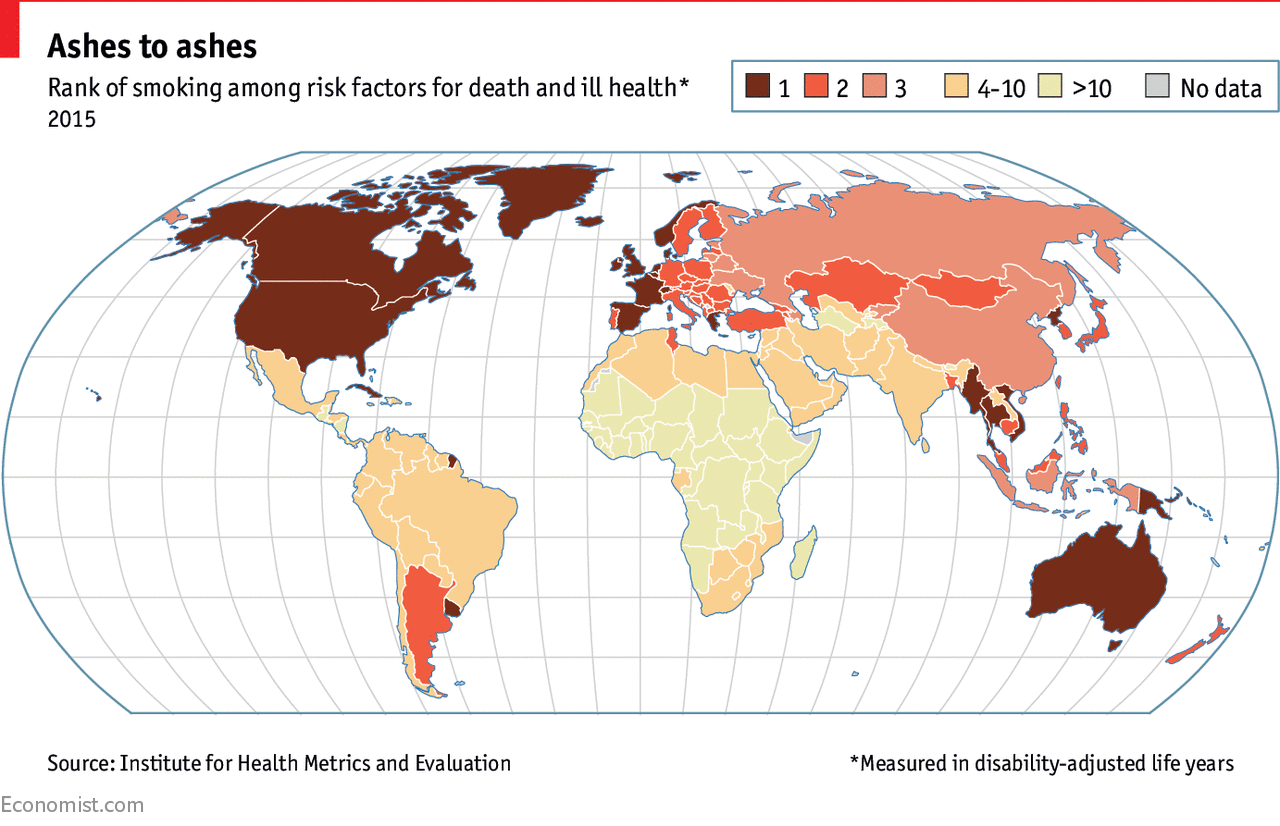
Nicotine is one of the most popular and far less strictly prohibited drugs. At the same time, smoking tobacco, which is the most common way of consuming nicotine, kills a huge number of people all over the world. The Economist mapped all countries according to what rank smoking has among risk factors for death and ill health nationwide. By the way, that might be entertaining to compare this data visualization with the map showing smoking bans by country – you’ll find it in the List of smoking bans article on Wikipedia.
We hope you’ve enjoyed this new collection published within the framework of our weekly series of cool data visualizations. And now we wish you an unforgettable weekend time!
- Categories: Data Visualization Weekly
- No Comments »
