Top Data Visualization Mistakes to Avoid
August 29th, 2017 by Jay Stevenson Data visualization is a fast and simple way to convey messages and concepts in an efficient manner. Besides improving the information relay, this approach has also changed the way business is done. Organizations that deal with large amounts of information on a daily basis can now process data and have the intended audience decipher it at lightning-fast speeds, thus enhancing the process of information management. However, data visualization mistakes are quite widespread, and let’s take a look what they are, why they are harmful, and how to avoid them.
- Categories: Business Intelligence, Charts and Art, Dashboards, Tips and Tricks
- 1 Comment »
Examples of Data Visualizations That People Like – DataViz Weekly
August 25th, 2017 by AnyChart Team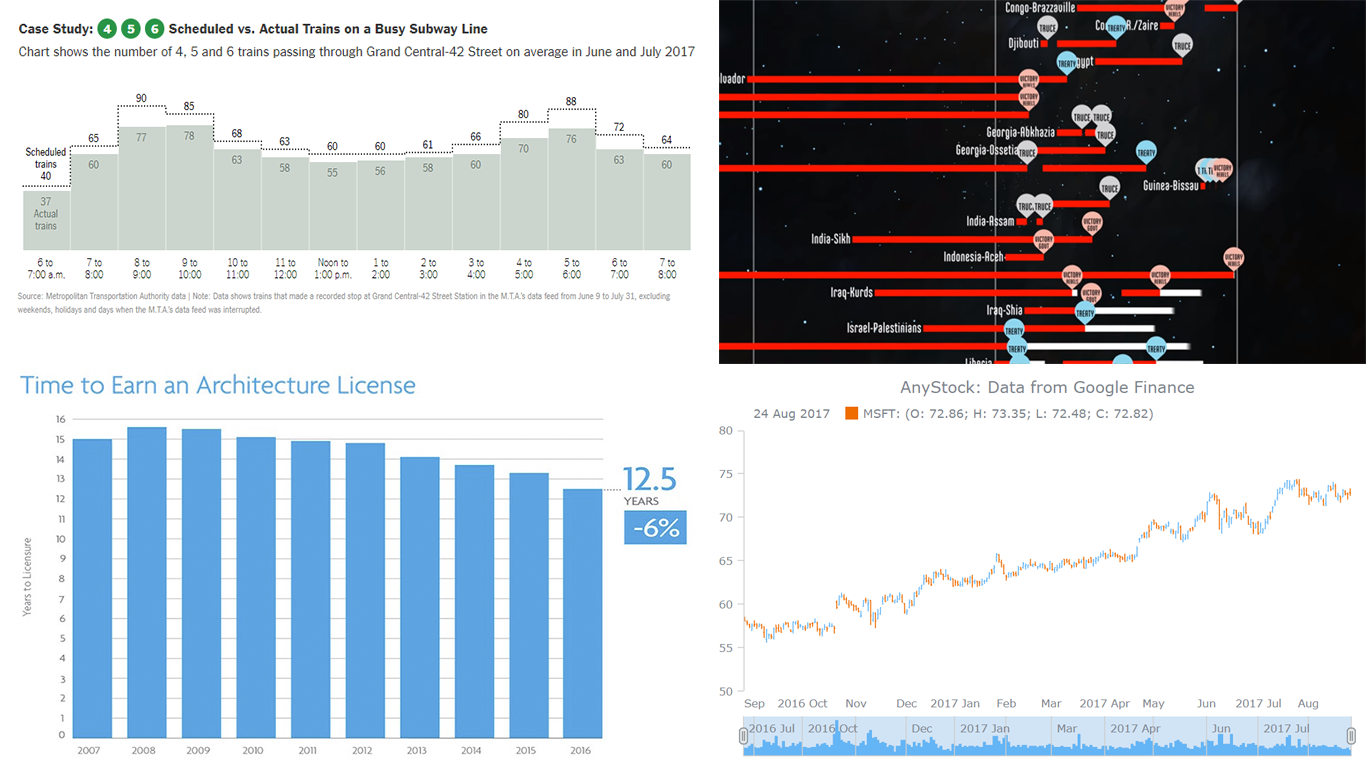 The new Data Visualization Weekly article reviews another set of interesting examples of data visualizations we’ve found on the Web: some amazing, some notable. In fact, data can speak much more clearly when visualized, allowing us to gain and remember more insights than we could reveal and remember from the texts and tables. The following dataviz works are vivid examples of that.
Let’s look at the following samples of creativity in the data visualization sphere:
- The Shadow Peace, a data-driven documentary on nuclear war;
- delays and cancellations in New York’s subway;
- time to earn an architecture license;
- visualizing large date and time based data.
- Categories: Data Visualization Weekly
- No Comments »
Inspirational Data Visuals To Drive the Message Home – DataViz Weekly
August 18th, 2017 by AnyChart Team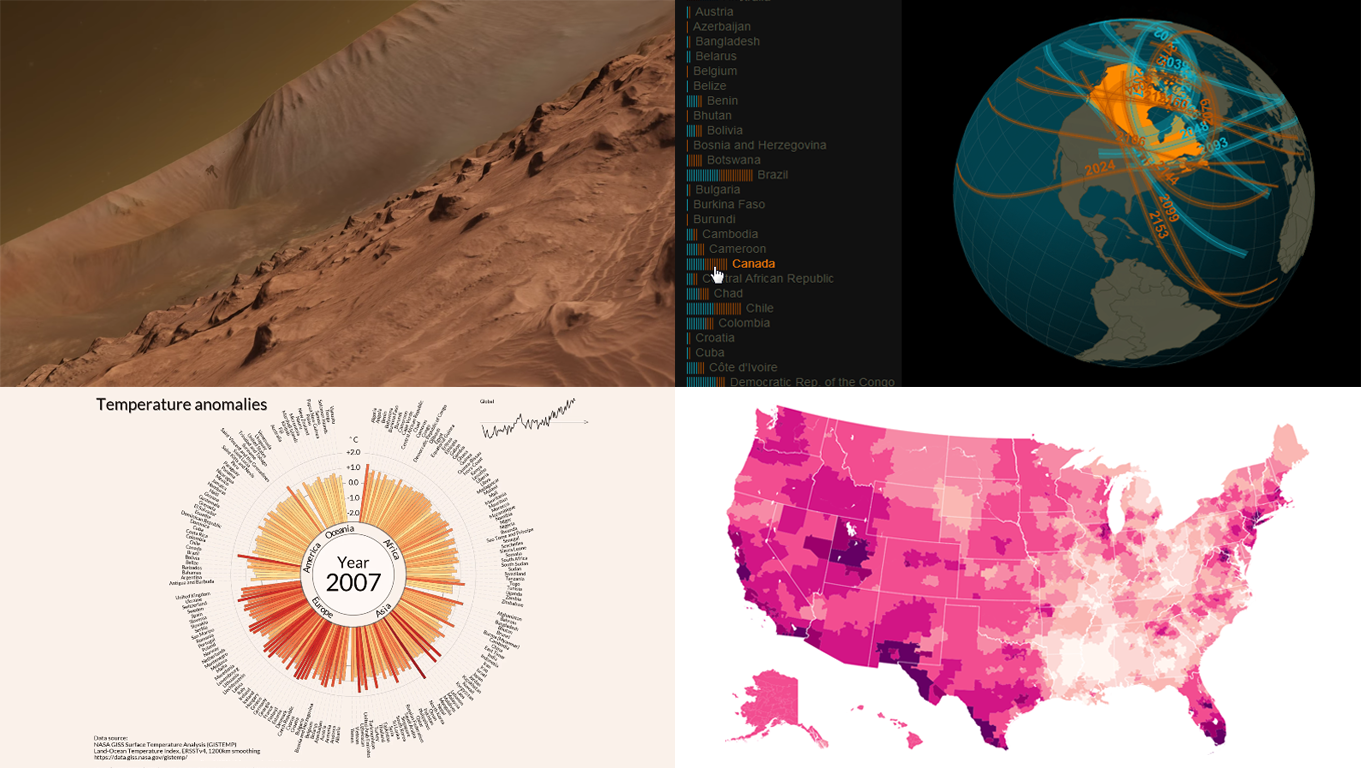 Data visualization (often shortened to ‘dataviz’) makes your data easier and more interesting to read as well as understand. A wide range of visual elements, including maps, charts and images are more effective at driving the message home. Check out our amazing compilation of data visuals pulled from the Web into the new article of Data Visualization Weekly. In fact, these became known just recently:
- New York Times’ detailed fan maps;
- Jan Willem Tulp’s solar eclipse map;
- Carter Emmart’s planet Mars astrovisualization;
- Lipponen’s amazing temperature anomalies chart.
- Categories: Data Visualization Weekly
- No Comments »
Interesting Charting Examples Shared Recently – Data Visualization Weekly
August 4th, 2017 by AnyChart Team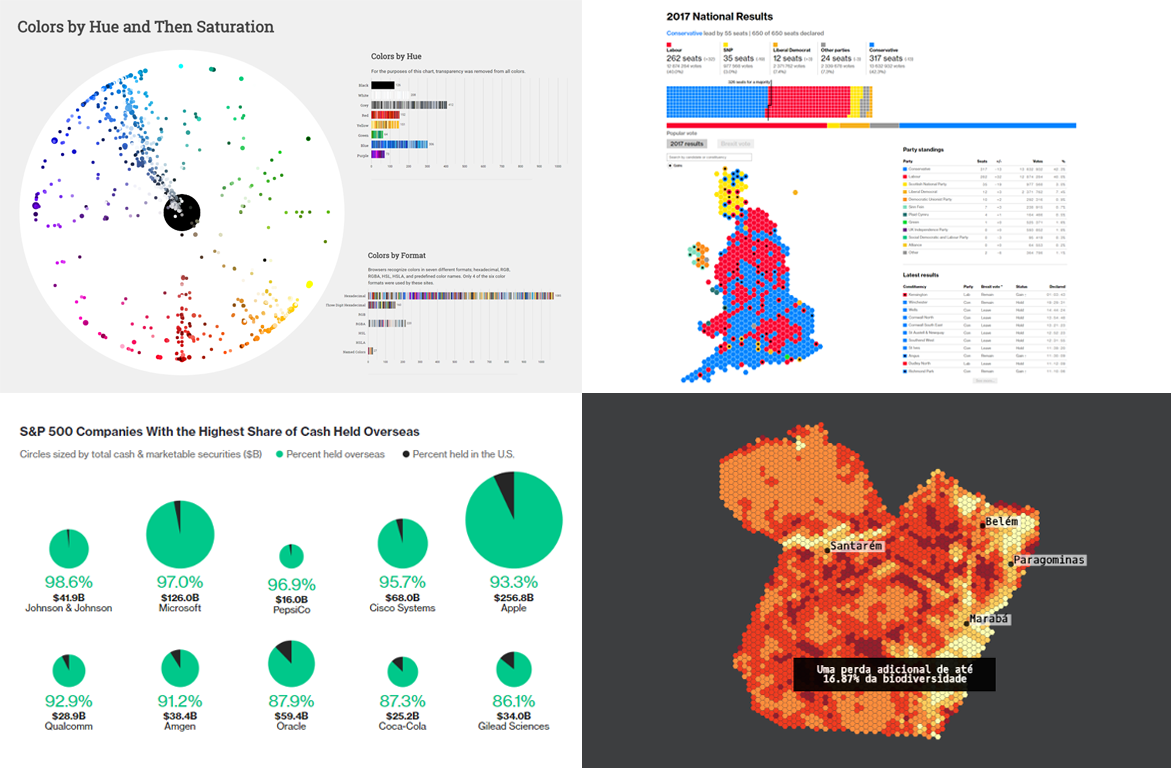 The first Data Visualization Weekly article in August 2017 is out! Check out the four interesting charting examples that we decided to share with you today:
- UK election results;
- the most popular colors on the most visited websites;
- S&P companies with the highest share of cash held overseas;
- forest degradation in the Brazilian Amazon.
- Categories: Data Visualization Weekly
- No Comments »