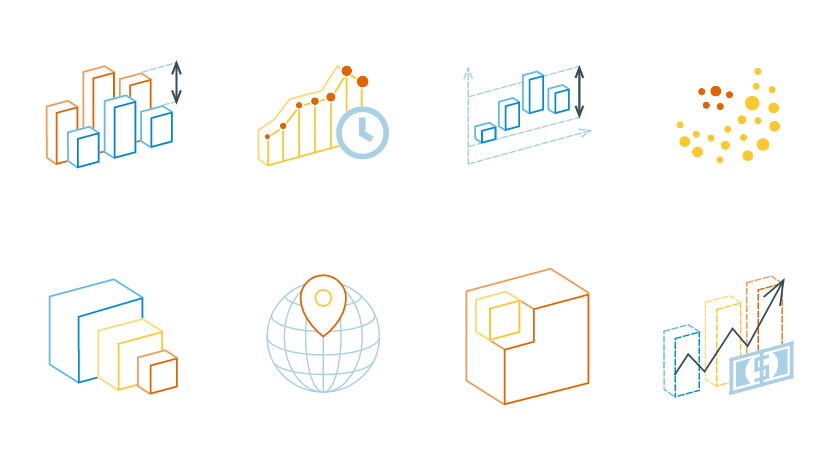
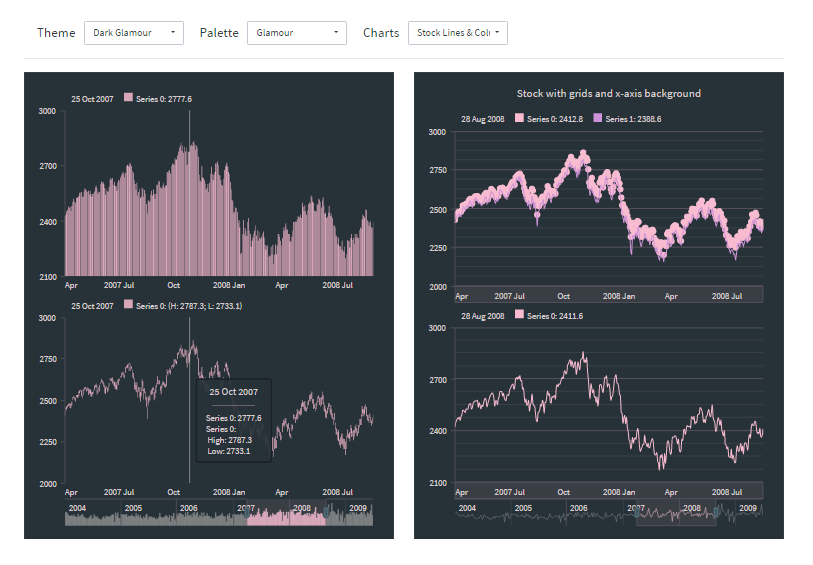
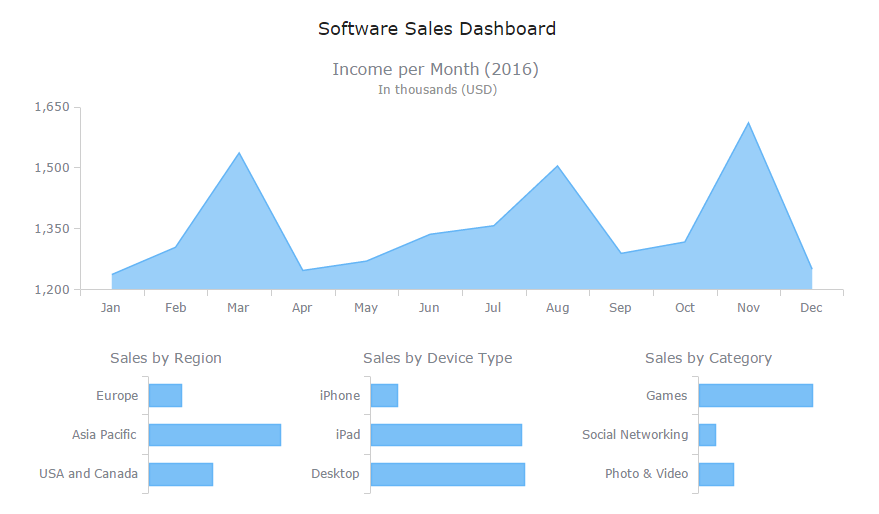
 Data visualization is a fast and simple way to convey messages and concepts in an efficient manner. Besides improving the information relay, this approach has also changed the way business is done. Organizations that deal with large amounts of information on a daily basis can now process data and have the intended audience decipher it at lightning-fast speeds, thus enhancing the process of information management. However, data visualization mistakes are quite widespread, and let’s take a look what they are, why they are harmful, and how to avoid them.
Brief History of Data Visualization
Data Visualization (often called shortly as DataViz) is one of the oldest concepts of the science of perception and many people are wrong to believe that the use of pictures, graphs, and charts in information communication technology is a fairly new idea.
The use of these visual elements to understand the message better in the 5th and 6th centuries is adequate evidence of data visualization’s early history. Bar charts were first created in the 14th century, and area charts emerged 200+ years ago.
Today, the graphical form of data presentation is used to help people recognize patterns, trends correlations and other issues that might otherwise go undetected in a text-based or other raw data. This results in the accurate interpretation of data for accurate decision making, but only if data visualization mistakes are indeed avoided.
4 Data Visualization Mistakes to Avoid
If done correctly, data visualization can help decision makers to see and interpret complex data in an easier and in-depth manner so that they can make more careful decisions based on meticulous analysis of the data. But if done poorly, it can prove to be a time-wasting and a counter effective approach towards information management.
A poor data visualization method can not only mislead but also lead decision makers to the wrong decisions. Besides that, it can also delay the decision making process and repel the audience. To get the most out of data visualization, it is important to avoid certain mistakes, including but not limited to the following.
#1: Choosing Wrong Chart Type
One of the most common data visualization mistakes is selecting an incorrect type of chart. Some of the most common varieties of charts are bar, column, radar, stacked and 100% stacked charts. Each chart type is designed for solving a certain range of tasks and therefore mistakes in picking the correct chart can mislead the viewer/reader’s perception and lead them to a deadlock.
Bar charts and column charts are ideal for data comparison across several categories based on their absolute or relative values. The most efficient way to depict data with these charts is by using horizontal and vertical bars in bar and column charts respectively.
A stacked bar chart, along with a stacked column chart as its variation, is a type of chart that uses bars to depict comparisons between various data categories, but with the ability to split and compare parts of a whole. Each bar in the chart denotes a whole whereas segments in the bar denote various categories of that whole. Stacked charts work great when featuring the total value for each category and also providing a hint as to how each category’s total value is broken down into parts.
100% stacked bar chart is a variation of the regular stacked column chart that compares the percentage that each value contributes to a total.
Check out the Choosing Chart Type series of seven articles as well as the Chartopedia resource to learn when to pick one chart or another and never make data visualization mistakes of this kind. Indeed, selecting the right one can be very intimidating whether or not you are good with charts. In fact, many data visualization experts sometimes misunderstand the purpose of some of these chart types. Our DataViz Expert (at AnyChart JS Charts) even wrote this article about stacked bar charts for Smashing Magazine, because another dataviz expert (at Tableau Software) appeared to completely misunderstand this form of visualization.
#2: Concentrating More On Infographics Than On Data Presentation
Another one of the top data visualization mistakes that dataviz creators tend to make is to present clustered data with meaningless infographics, making it difficult for the audience to figure out where as well as what to concentrate on.
Yes you’ve done your research and collected more than enough data to support your findings and you can’t wait to impress your audience with your thoroughness and data presentation skills, but putting together your data in a chaotic jumble with unnecessary infographics is a sure way to turn off everyone the moment they set their eyes on it.
Speaking about data visualization mistakes, it is important to stress that dataviz is not all about infographics. Pictures and visual decorations must not form a significant part of your business visualizations. In terms of color, for example, adhering to elaborate themes and palettes is usually a good way. Generally speaking, the fewer elements distract the viewer/reader from data and its analysis, the better it gets to understand data, analyze it correctly and get more comprehensive insights you intend to deliver by means of visualizing your data.
#3: Reinventing Your Own Charts
Many people are familiar with some of the most common varieties of charts available, which are bar, column, radar, stacked and 100% stacked charts as we mentioned above, and there are actually a lot of a lot of elaborate chart types out there all in all. They are used to the standard way in which certain types of data are usually displayed, using the charts.
Since a lot of individuals already have that pattern of charts in their mind, it means that any nonconformity with the conventional methods of data presentation using charts would only make the reading and interpretation of your data difficult or even mistaken.
Do not come up with your own style as far as charts are concerned. It is just not advisable and in most cases is one more of quite widespread data visualization mistakes. Do your best stick to the more standard chart presentation methods as possible in each certain case and get to building custom charts only when that is reasonable.
#4: Making Audience Do More Work
As said earlier, dataviz helps people decipher data quickly and easily. But there are some data visualization mistakes that can be a pain in the neck to every reader. For instance, not bothering to add notes to the text or diagram to give meaning to the data is something that many people will not appreciate.
Sometimes a chart alone isn’t enough to help the reader understand the message. You need to incorporate appropriate chart captions and annotations in especially complex/complicated places within your chart or graph to make it easier for your readers to read and understand the data. However, remember that – just like in point #3 here – there is a risk to overload your charts with superfluous visuals.
Conclusion
While data visualization remains to be a very powerful way of relaying information, it can as well prove very counterproductive if done incorrectly. Good data visualization approaches can help decision makers read and interpret data more accurately and hence make better decisions based on correct interpretation. On the other hand, poor data visualization practices could produce misleading results.
Choosing the wrong chart types, concentrating more on infographics than on letting data speak, reinventing your own charts and not completing your charts and graphs with correct annotations are some of the top data visualization mistakes that many people tend to make when it comes to visualizing data. However, just be careful and attentive, and you will be fine.
What do you think about these top dataviz mistakes? What other mistakes have you ever seen or made? Comment below and let us know your thoughts.
- Categories: Business Intelligence, Charts and Art, Dashboards, Tips and Tricks
- 1 Comment »


