 Want to know how to build a JavaScript area chart? This article will show you how to do that and tell you who invented area charts in the late 18th century.
The area chart is one of the basic charts used to show changes in data over time. The key feature of this chart type is a colored area between the horizontal X-axis and the line marking the changing value. It can be filled with a color, gradient color, or with a hatch fill.
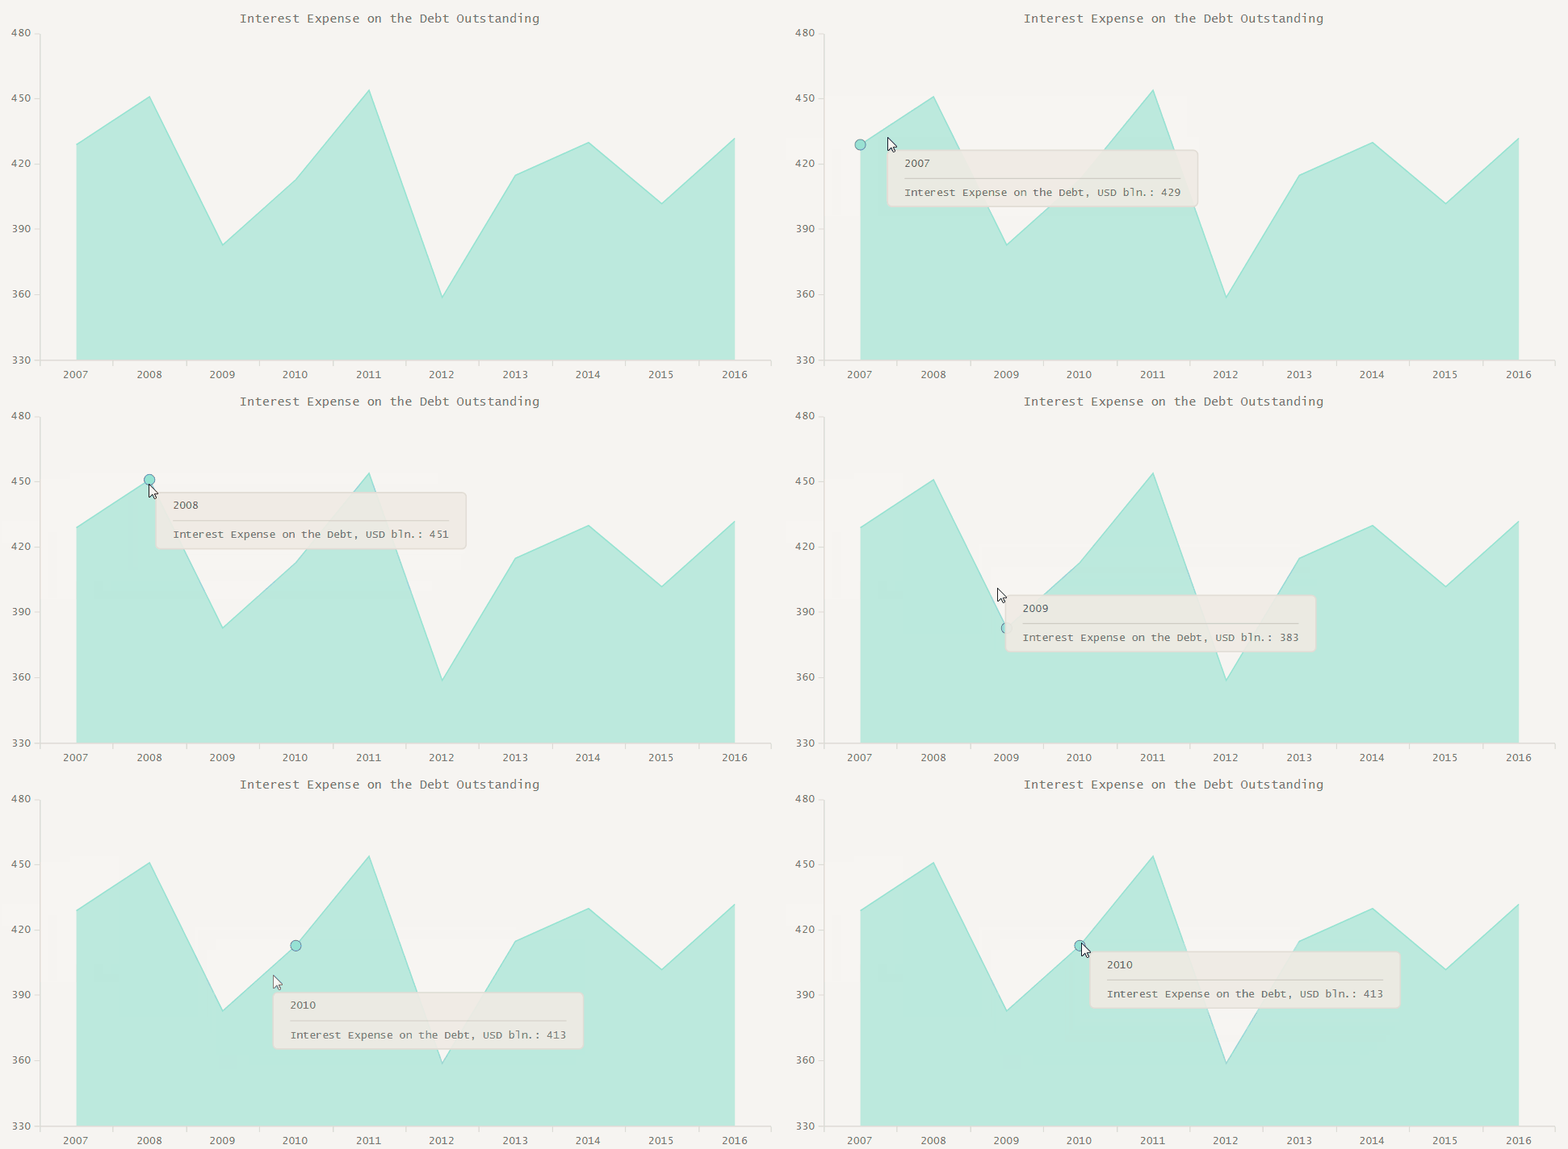
Look at the chart on the title image. That’s the data visualization being created along the tutorial. Such a JavaScript-based area chart will be interactive and good-looking in any browser, on any website and in any app in HTML5. All samples used in the article are available in our collection on CodePen.
Building JavaScript Area Chart
Basically, there are four steps you should do to create a chart of any type. Look through this section and follow the simple steps to learn how to make an interactive HTML5 area chart like this using JavaScript:

1. Create an HTML page
First of all, it is necessary to create a page where your chart will be put in. The following code demonstrates how it should look like:
<!DOCTYPE html>
<html>
  <head>
    <title>JavaScript Area Chart</title>
  </head>
  <body>
    <div id="container" style="width: 100%; height: 100%"></div>
  </body>
</html>
The container that you see in the <body> section creates a container for the chart on the page. If you don’t want the chart to fill the whole HTML page, change the width and height parameters.
2. Reference all necessary files
The second step is about adding links into the <head> section. It is necessary to link a JavaScript charting library and create a tag where the code of the chart will be inserted:
<!DOCTYPE html>
<html>
  <head>
      <title>JavaScript Area Chart</title>
      <script src="https://cdn.anychart.com/releases/8.0.1/js/anychart-base.min.js"></script>
  </head>
  <body>
    <div id="container" style="width: 100%; height: 100%"></div>
    <script>
        <!-- chart code will be here -->
    </script>
  </body>
</html>
3. Put together the data
The most important part of any chart is data. Scottish engineer and political economist William Playfair is credited as the first person in history to implement area charts. Playfair used them to show the changes of Interest of the National Debt and Imports and Exports to and from England.
Let’s do what he did, and visualize the Interest Expense on the Debt Outstanding according to the data from TreasuryDirect:
| Interest Expense on the Debt Outstanding | |
| Year | Interest Expense on the Debt, US dollars |
| 2007 | $429,977,998,108.20 |
| 2008 | $451,154,049,950.63 |
| 2009 | $383,071,060,815.42 |
| 2010 | $413,954,825,362.17 |
| 2011 | $454,393,280,417.03 |
| 2012 | $359,796,008,919.49 |
| 2013 | $415,688,781,248.40 |
| 2014 | $430,812,121,372.05 |
| 2015 | $402,435,356,075.49 |
| 2016 | $432,649,652,901.12 |
Now, let’s create the data object:
// set the data
var data = {
  header: ["Year", "Interest Expense on the Debt"],
  rows: [
    [2007, 429977998108.20],
    [2008, 451154049950.63],
    [2009, 383071060815.42],
    [2010, 413954825362.17],
    [2011, 454393280417.03],
    [2012, 359796008919.49],
    [2013, 415688781248.40],
    [2014, 430812121372.05],
    [2015, 402435356075.49],
    [2016, 432649652901.12]
]};
4. Write the code for the chart
This is the last step of creating a simple interactive area chart. As you can see, building charts in JavaScript is not a big deal.
You only need to add the onDocumentReady function, like shown below:
<script>
anychart.onDocumentReady(function() {
    // the code to create an area chart will be here
});
</script>
Now, add the data into the function, create the chart and draw it into a container, and the chart is ready.
anychart.onDocumentReady(function() {
  // set the data
  var data = {
    header: ["Year", "Interest Expense on the Debt, USD bln."],
    rows: [
      [2007, 429],
      [2008, 451],
      [2009, 383],
      [2010, 413],
      [2011, 454],
      [2012, 359],
      [2013, 415],
      [2014, 430],
      [2015, 402],
      [2016, 432]
  ]};

  // create the chart
  var chart = anychart.area();

  // add the data
  chart.data(data);

  chart.container('container');
  chart.draw();
});
That’s how it looks:
See the Pen Creating a JavaScript Area Chart: Basic Example by AnyChart JavaScript Charts (@AnyChart) on CodePen.
Add Chart Title
Chart title is not necessary but it helps to grasp the context faster. Check out our article on how to write a great chart caption if you want to perfect your chart captioning skills. To provide the chart with the title, simply add this line:
// set the chart title
chart.title("Interest Expense on the Debt Outstanding");
And the JavaScript area chart we’ve built becomes properly captioned:
See the Pen Creating a JavaScript Area Chart: Chart Title Added by AnyChart JavaScript Charts (@AnyChart) on CodePen.
Tune Chart Appearance
Now, let’s customize the chart design by changing the default theme of the area chart to "sea". First, we reference a file with the theme from CDN:
<script src="https://cdn.anychart.com/themes/8.0.1/sea.js"></script>
Then, add a line of code changing the theme:
// set sea theme
anychart.theme("sea");
Here’s how the interactive JS area chart with the "sea" theme applied looks like:
See the Pen Creating a JavaScript Area Chart by AnyChart JavaScript Charts (@AnyChart) on CodePen.
Using themes makes it very easy to modify the appearance of a data visualization. See the list of all available themes in Chart Themes Demo.
Conclusion
This tutorial tells you how to make a beautiful, interactive HTML5 area chart using the AnyChart JavaScript charting library. Visit the AnyChart homepage to know more about the library and other chart types you can build with it. AnyChart Documentation and AnyChart API will help you tune your JS charts in a way you prefer.
- Categories: AnyChart Charting Component, HTML5, JavaScript, JavaScript Chart Tutorials, Tips and Tricks
- 3 Comments »