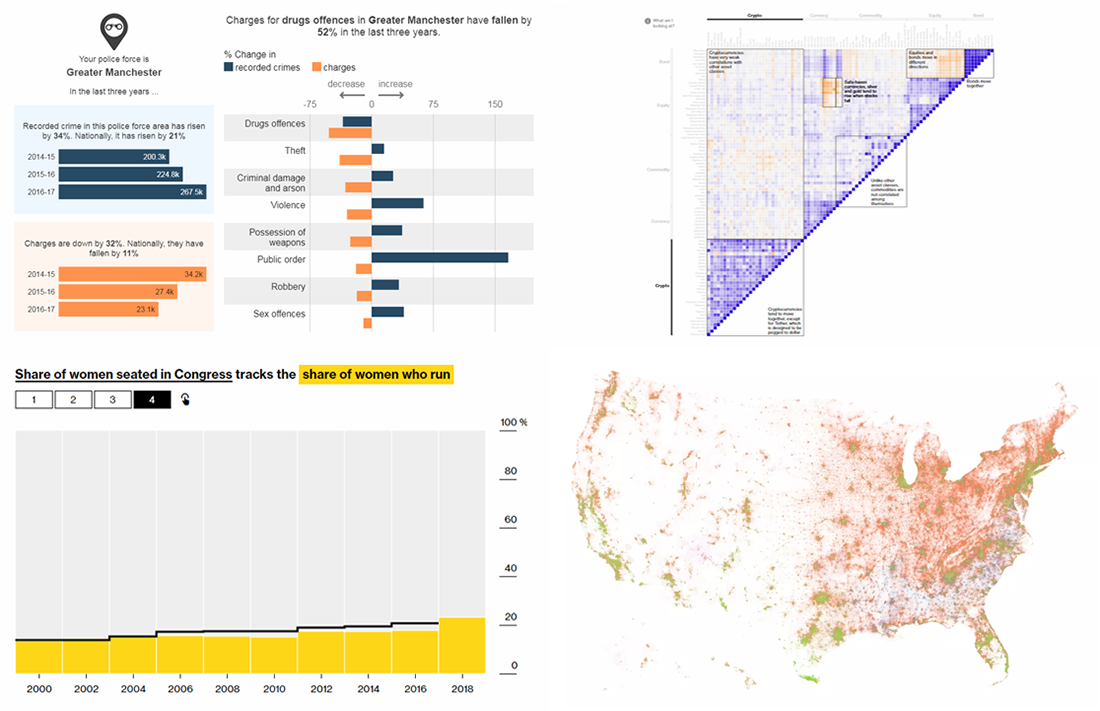
 Visualization often makes analyzing data easier and more insightful, allowing us to quickly notice trends, correlations, and make other important conclusions. We continue DataViz Weekly, a series of articles designed to show you interesting real-world examples of charts and how they can let data speak.
Today, we are happy to meet you with the following new pieces:
- cryptocurrencies against other investments;
- more crimes, fewer charges — UK police data;
- what would happen to the US population if all non-natives left;
- record numbers of women in US House and Senate races.
Data Visualization Weekly: May 11, 2018 — May 18, 2018
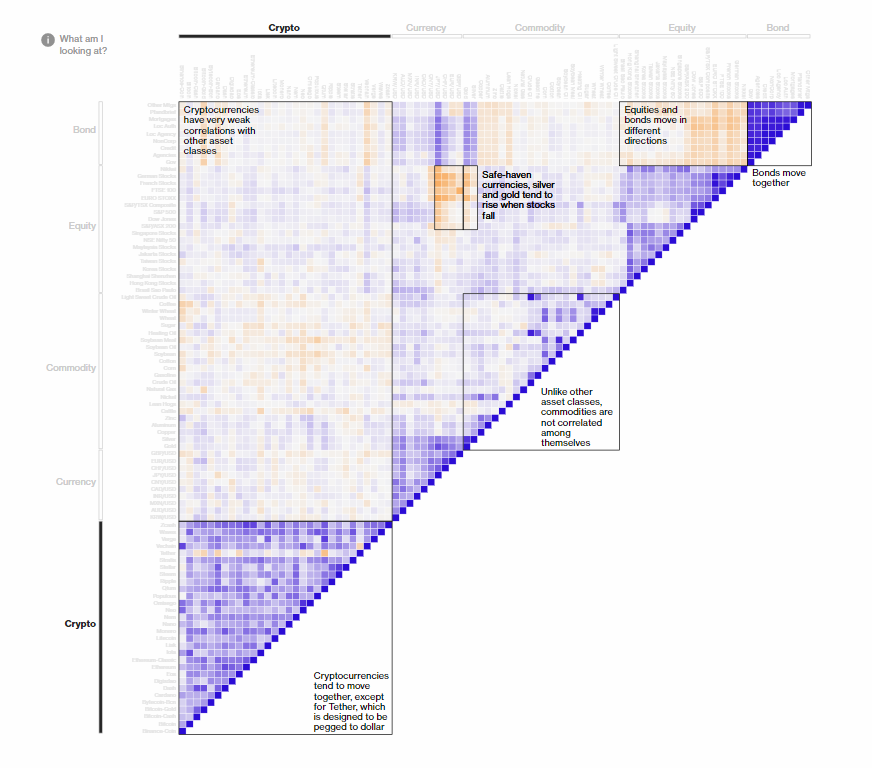
How Cryptocurrencies Stack up Against Other Investments

Bloomberg takes a look at cryptocurrencies from the point of view of how they stack up against commodities, currencies, and other investments. There are many interesting charts in the article. Especially do not miss out on the big interactive one providing an interesting picture of how assets affect each other in terms of moves in a market.
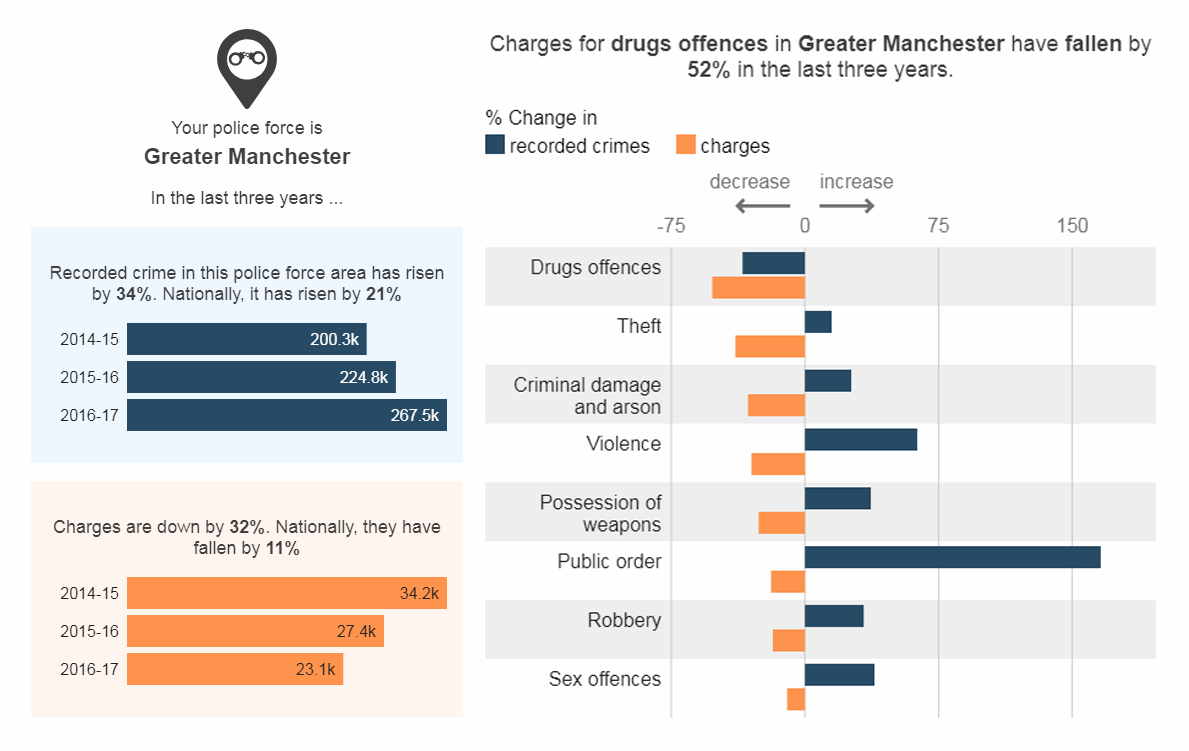
Analyzing Data from UK Police: More Crimes, Fewer Charges

According to Home Office data, the number of crimes in England and Wales has been growing whereas the number of criminal charges has been falling. Read about what BBC found out while analyzing data, look at multiple charts, and check the situation in each police area one by one.
If All Non-Native US People Leave

Nathan Yau shows what would happen to the population of the United States if everyone really decided to “go back where they came from.” The dot map pictured above shows the whole American population, visualizing each person as a dot. Now check out the other maps in the article to imagine non-natives start leaving.
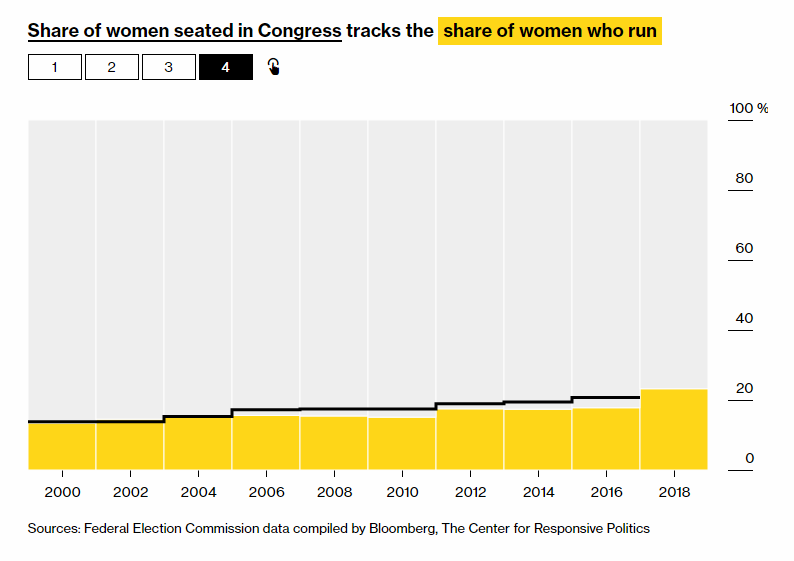
US Senate and House Races Joined by Record Numbers of Women

As of April 30, 527 women have already joined the races for the United States House of Representative and the United States Senate as candidates for the midterms in November 2018. And it is a record number. Join Bloomberg in analyzing data along with personal stories of several women candidates.
***
We’ll show you more cool dataviz examples next time. Stay tuned for Data Visualization Weekly!
- Categories: Data Visualization Weekly
- No Comments »