Visualizations About Election, Jobs, Stars, and Being Young — DataViz Weekly
July 27th, 2018 by AnyChart Team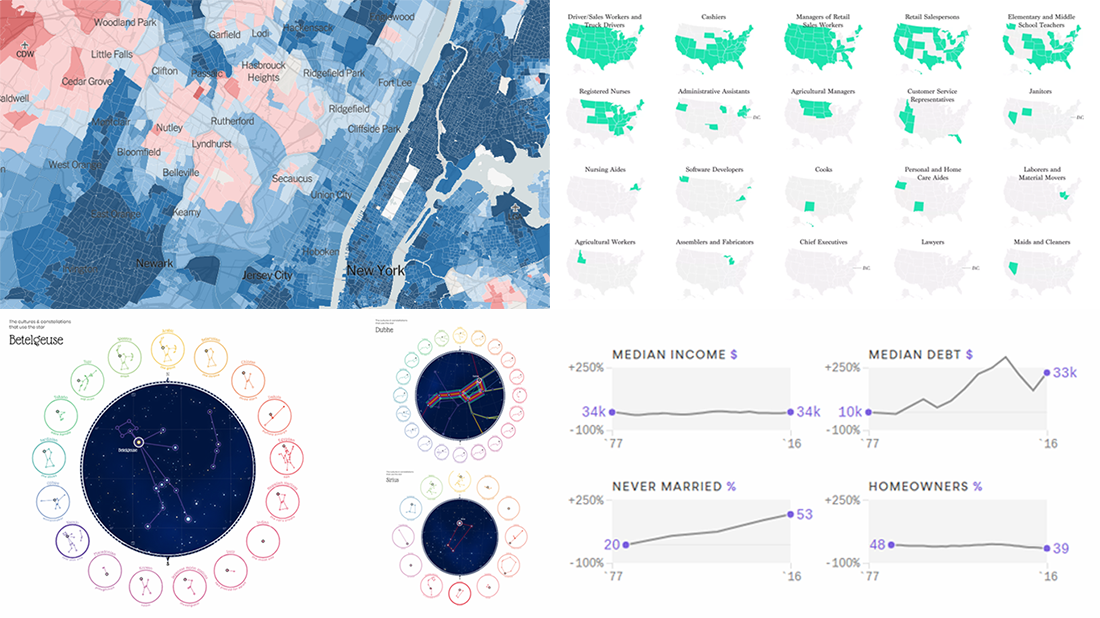 It’s already Friday, so don’t hesitate to check out the new DataViz Weekly post on our blog. Here you’ll find visualizations about:
- 2016 U.S. presidential election, by voting precinct;
- the most popular jobs in the United States, by state;
- what’s changed in the life of young American adults in 1977-2016;
- different constellations seen by different cultures in the same sky.
- Categories: Data Visualization Weekly
- No Comments »
Information Graphic Works About Street Orientation, Earnings, Birth Control, and Car Output — DataViz Weekly
July 20th, 2018 by AnyChart Team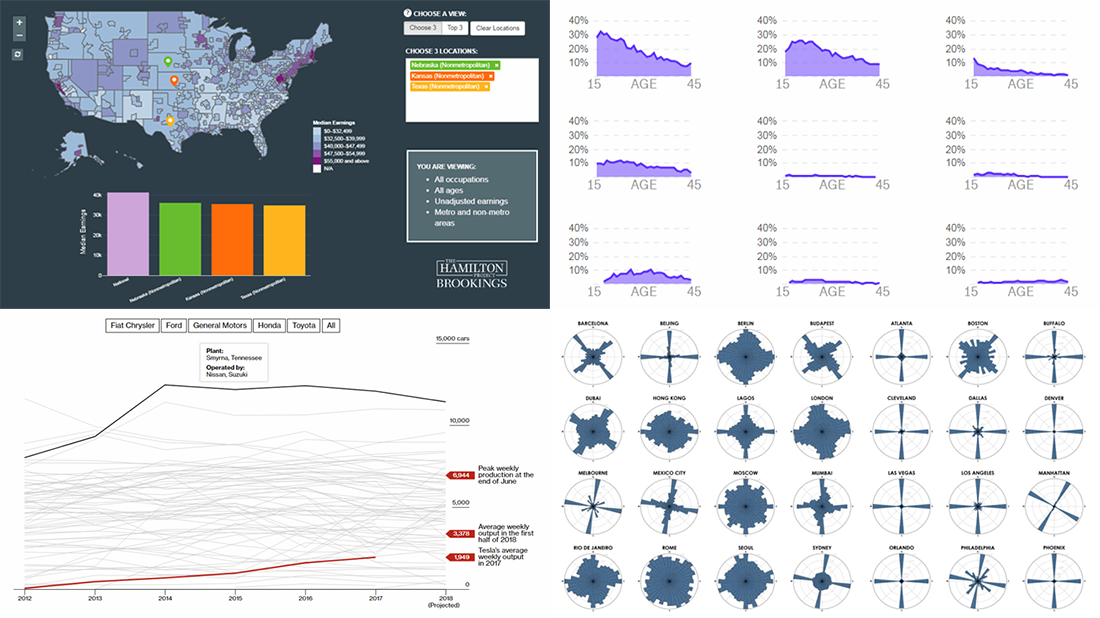 Not only is the AnyChart JS Charts blog a go-to place for our news and tips and tutorials. It’s also where — within the framework of our regular DataViz Weekly feature — we keep you posted on new interesting data visualizations from out there on the web. Today, we’ve chosen to highlight the following information graphic works:
- street orientation in cities around the world;
- occupations and earnings across the United States;
- birth control methods;
- car output of Tesla against North America’s most productive factories.
- Categories: Data Visualization Weekly
- 1 Comment »
Visualizing Recurring Patterns in Data, Area Deprivation Index, Corporate Debt, and Childhood Obesity — DataViz Weekly
July 13th, 2018 by AnyChart Team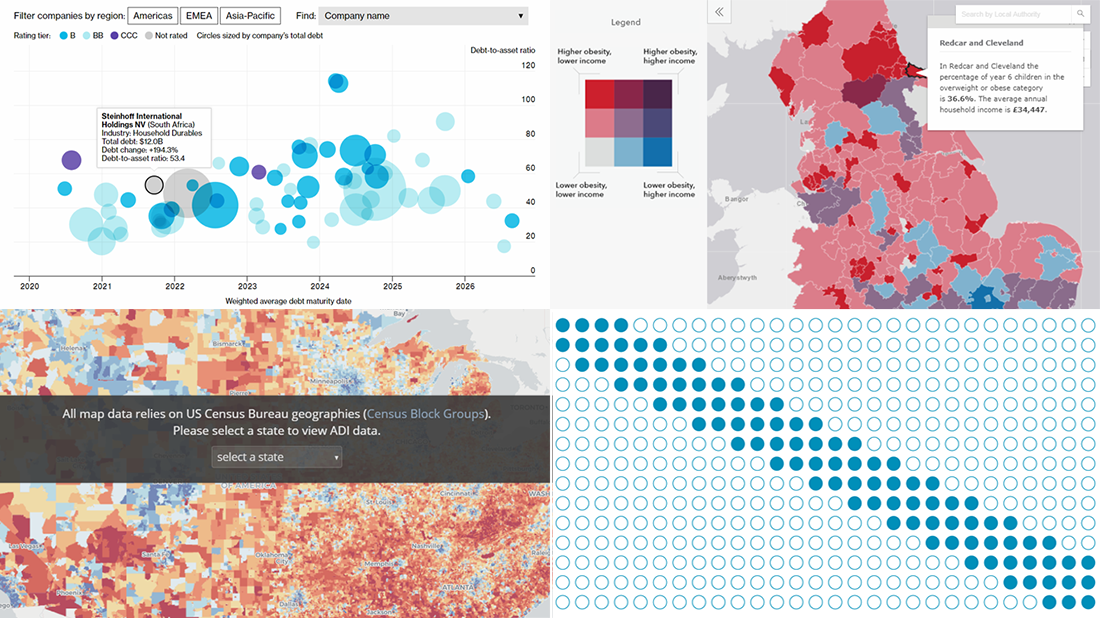 Visualizing recurring patterns that may be recognized in data, socio-economic deprivation neighborhood by neighborhood across the United States, the global corporate debt issue, and England’s childhood obesity — these topics are in the focus of the new DataViz Weekly digest that we are glad to present right now.
- Categories: Data Visualization Weekly
- No Comments »
JS Chart Libraries Get New Great Features in 8.3.0 Release of AnyChart, AnyStock, AnyMap and AnyGantt
July 10th, 2018 by AnyChart Team We at AnyChart are proud to announce the 8.3.0 release of our JS chart libraries AnyChart, AnyStock, AnyGantt, and AnyMap! The present major update brings full support of HTML in tooltips, background settings for chart data bounds, coloring rules and thresholds, easy axis label positioning, new technical indicators, and even more.
- Categories: AnyChart Charting Component, AnyGantt, AnyMap, AnyStock, Financial Charts, Gantt Chart, HTML5, JavaScript, News, Stock Charts
- 6 Comments »
Data Graphics About Batteries, Trump, Environment, and Soccer — DataViz Weekly
July 6th, 2018 by AnyChart Team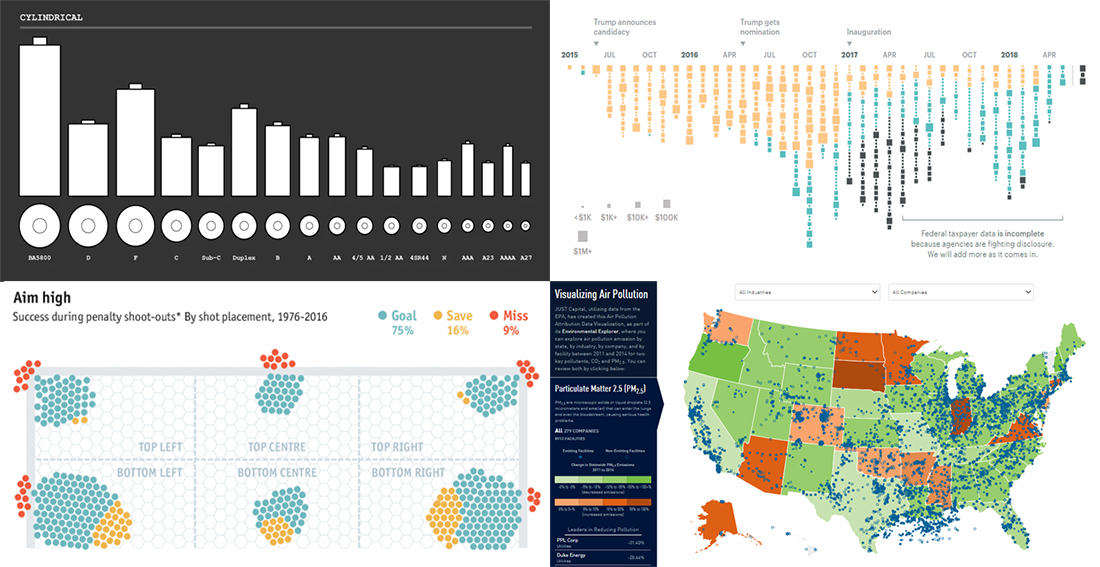 Hello Friday! DataViz Weekly is here to entertain you with several new interesting data graphics we’ve recently come across.
Here’s a quick list of what visualizations we are glad to draw your attention to this time, to start with:
- all battery sizes;
- political and government spendings at Donald Trump’s properties from 2015 to 2018;
- Environmental Explorer;
- FIFA World Cup and UEFA Euro penalty shoot-outs.
- Categories: Data Visualization Weekly
- No Comments »