 Following the 8.4.0 release of the AnyChart JS Charts library, now we’ve also got an awesome major update for our data visualization extension for Qlik Sense. Its version 2.5.0 is already available, adding Gantt Chart and Tag Cloud to the list of supported chart types.
Meet AnyChart Qlik Extension 2.5.0!
What’s New in AnyChart Qlik Extension
 |
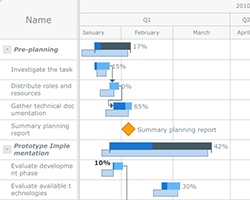
Gantt ChartProject Gantt Chart is a chart type designed to display progress in completing a single task or a group of tasks, taking into consideration planned and actual time periods in line with progress made, as well as tasks’ hierarchy and order. Learn more about Gantt Charts on Chartopedia. |
 |
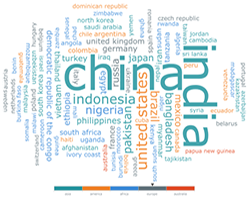
Tag CloudTag Cloud, sometimes also called Word Cloud and Weighted List, is a form of visual representation of text data. This chart type is typically utilized to show keyword metadata (tags) on websites and visualize free form text. Tags are usually single words, and the importance of each tag, which is often based on its frequency, is highlighted with font size or color. Learn more about Tag Clouds on Chartopedia. |
In addition to the two new chart types, the 2.5.0 version also brings a significant improvement: Enjoy an upgraded data fetching mechanism for your best possible experience!
Next on Roadmap for Qlik Extension
Many of you already know we’ve added Sankey diagrams to AnyChart JS Charts this fall. Well, here’s an awesome news for Qlik fans in line with that. We are going to include the Sankey diagram chart type in our extension for Qlik Sense with the next big update scheduled for as soon as late 2018!
If there is any other chart type or feature you need and would like us to add, just drop a note to our Support Team. We always attentively listen to our customers and will be happy to honor your request.
Enjoy advanced interactive data visualization and reporting with the flexible and easy-to-use AnyChart extension for Qlik Sense!
- Categories: AnyChart Charting Component, Qlik
- No Comments »