 AnyChart 8.9.0 is out! The latest major update brings new exciting out-of-the-box features to our award-winning JavaScript charting library product family — AnyChart, AnyStock, AnyGantt, and AnyMap. Enjoy the improved functionality and build even more compelling data visualizations for your web sites and apps in less time!
New JS Chart Features
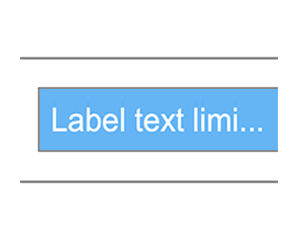 |
Label Text LengthNow you can limit the number of characters shown in chart labels. This new option gives you easier control over the display of your charts. |
 |
Client-Side CSV/XLSX ExportStarting with the 8.9.0 version, CSV and XLSX can be exported right there on the client side! So you do not need the export server’s help to complete that anymore. |
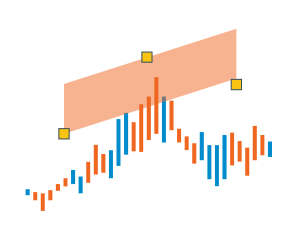 |
Finite Trend Channel AnnotationAnother helpful drawing tool is now available in stock charts: Meet the Finite Trend Channel! Check it out in action on top of an OHLC chart in our gallery and don’t miss out on our general Drawing Tools and Annotations Demo to see what other helpful instruments are currently at your disposal. |
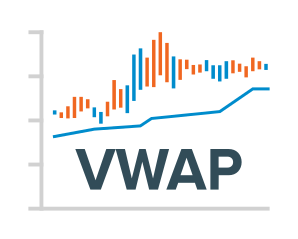 |
Volume-Weighted Average Price IndicatorContinuing to extend the technical analysis capabilities, we’ve added a new indicator — the Volume-Weighted Average Price. VWAP does exactly what its name suggests. It measures the average price over a certain time horizon by determining the ratio of the value to the total volume. We’ll add the VWAP indicator to our Technical Indicators Demo soon. In the meantime, you can find its demonstration here. |
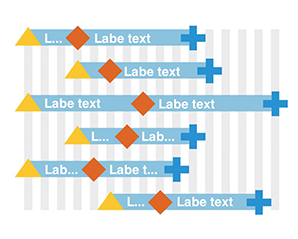 |
Gantt Chart Labels OverlapFor Gantt charts, we’ve added the option to truncate labels when they overlap. Enjoy the quick way to make your project and resource visualizations look especially neat. |
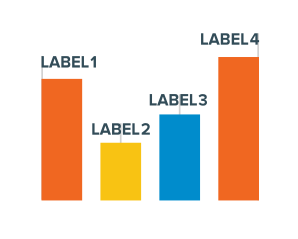 |
Improved Placement of First and Last LabelsTo further enhance how your data visualizations look with labels, we’ve also ensured the first and last labels in all regular charts now always find their best place on the chart. As a result, the chart display has become even more consistent and appealing. |
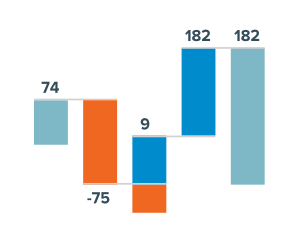 |
Waterfall Stack Labels (Multi-Series)In a multi-series Waterfall chart, now it is as easy as never to create an extra label showing the sum of the stack. Here’s how it works — check it out and feel free to make use of this new feature right away. |
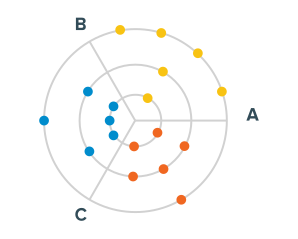 |
Automatic Placement of Polar PointsPolar charts can now automatically spread data points along the category if you tell them so. In particular, this allows you to create a so-called Bullseye chart without hassle! |
More Enhancements
In addition to those new JavaScript chart features, we have also made some important improvements and bug fixes. To make sure nothing is missed, look at the complete release notes in the version history of the library you are using:
Share Feedback
So how do you like the AnyChart 8.9.0 release? What else may we do to further improve the way you visualize data using our solutions?
Don’t keep it to yourself, please! We look forward to your feedback and would love to adjust our roadmap according to your specific needs. Just contact our awesome Support Team and tell them everything.
Enjoy the new AnyChart JS Charts!
- Categories: AnyChart Charting Component, AnyGantt, AnyMap, AnyStock, Big Data, Business Intelligence, Dashboards, Financial Charts, Gantt Chart, HTML5, JavaScript, News, Stock Charts
- 2 Comments »
Comments (2)
I don’t know whether it’s just me or if perhaps everyone else experiencing problems with your site.
It appeads like some of the text within your content are running
off the screen. Cann somebody else please comment
and let me know if this is happening to them as well?
This might be a issue with my webb browser because I’ve
had this happen previously. Kudos
Hi Lisa. All should be fine. But: Are you opening our website on a desktop or mobile device? What browser are you using?