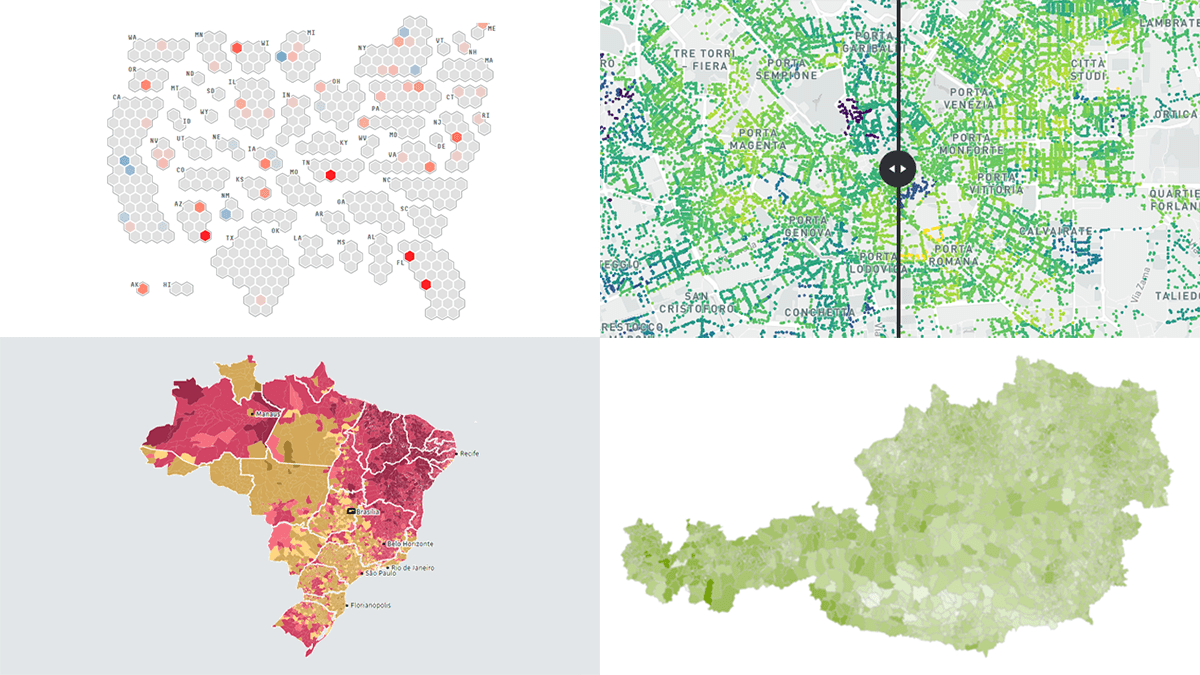
 Some of the election races scheduled for this fall have already ended. Others are yet to be decided. And obviously now is a time for election maps to shine again! In this DataViz Weekly piece, we highlight a selection of maps visualizing data on the recent votes in Italy, Austria, and Brazil, as well as the upcoming midterm elections in the United States. Take a look.
Data Visualization Weekly: October 7, 2022 — October 14, 2022
Italia Election Maps
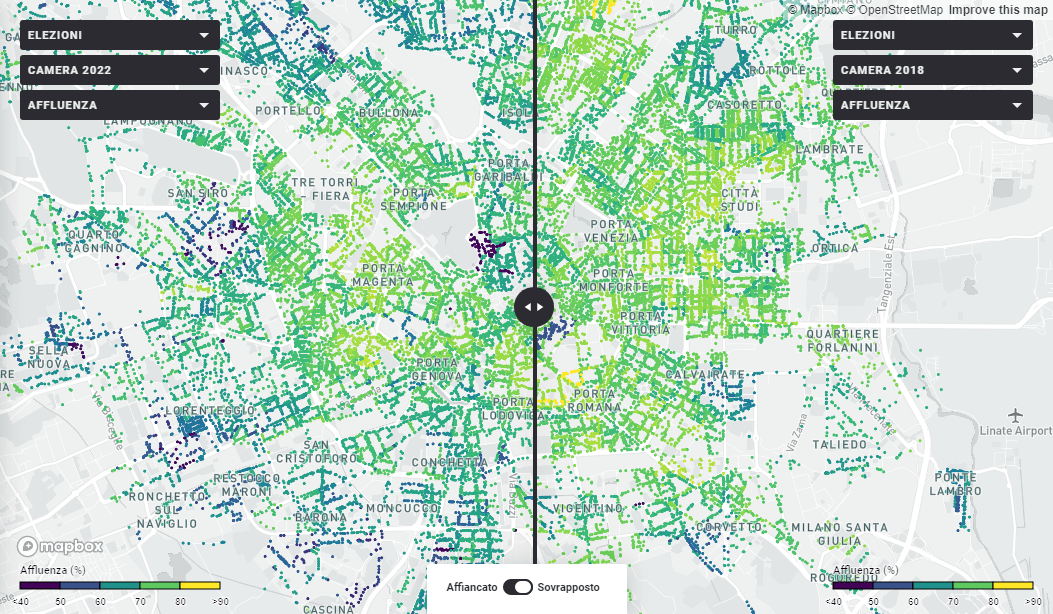
The 2022 Italian parliamentary election was won by the right-wing coalition led by the far-right Fratelli d’Italia (Brothers of Italy) party. Now the coalition will form the next government of Italy.
The project called “Il voto strada per strada” (“The vote street by street”) created by research laboratory DataInterfaces, a collaboration between ISI Fondazione (ISI Foundation) and Politecnico di Milano (Polytechnic University of Milan), maps the outcome in four large cities — Milan, Turin, Bologna, and Florence — with a very high level of granularity. It also allows you to compare the results to previous elections and sociodemographic indicators.
For a bigger picture view, you are welcome to check out the set of maps and charts made by the Guardian and Corriere della Sera.
Austria Election Maps
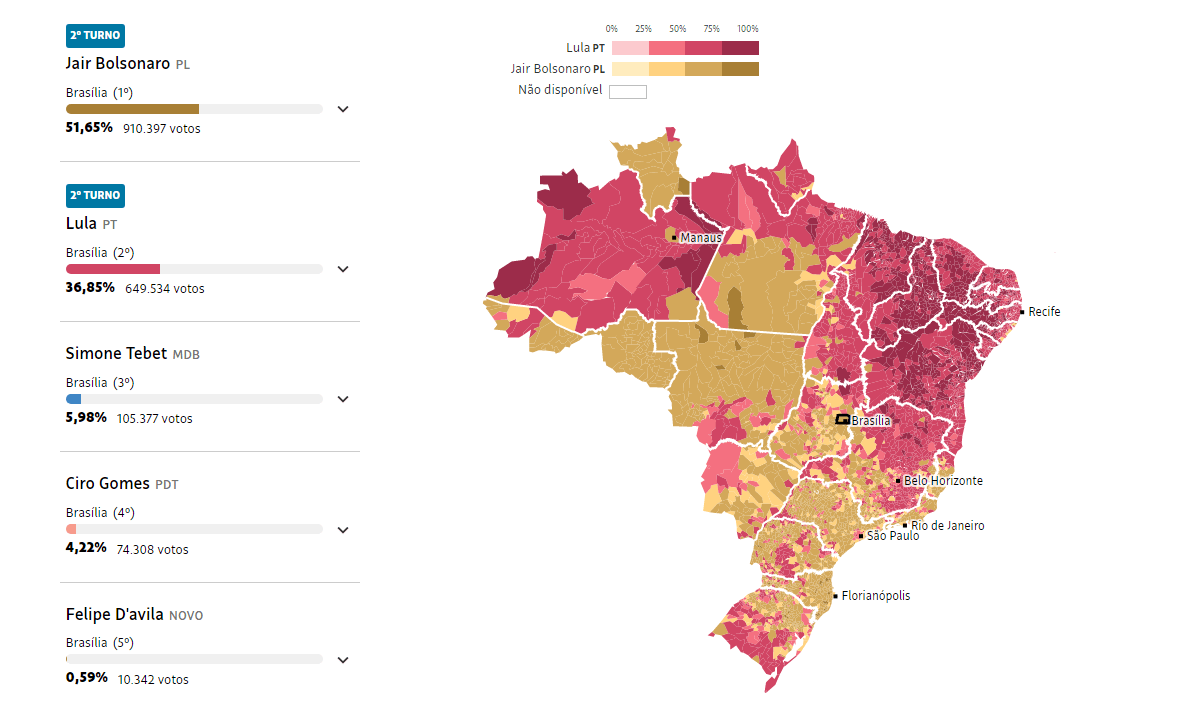
In the 2022 Austrian presidential election, current president Alexander Van der Bellen from the Greens – The Green Alternative party won in 2,073 of the 2,115 municipalities. So he is now officially re-elected as the head of state for the next six-year term.
oe24.at, the internet portal of the Austrian daily newspaper Österreich, published an interactive map showing the results of the election in Austria down to the municipal level.
A similar map is available on the 23° platform in case you are interested.
Brazil Election Maps
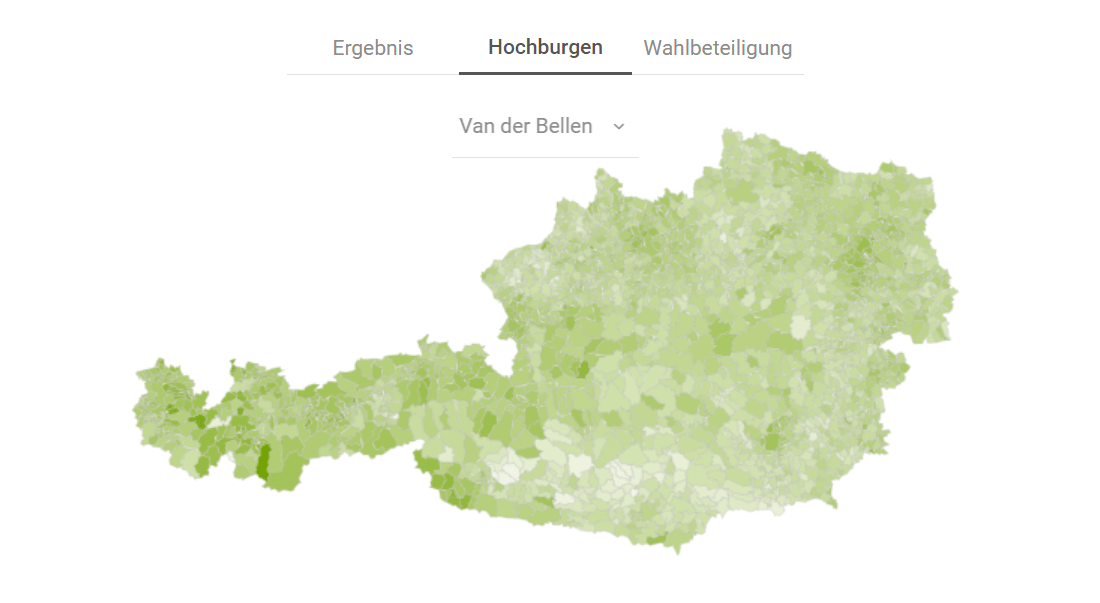
BVrazil’s former president Luiz Inácio Lula da Silva won in the first round of the 2022 Brazilian presidential election. But the number of votes he gained was not enough to get elected. Now he will face the current president, Jair Bolsonaro, in the second round scheduled for October 30.
Bloomberg mapped the results of the first-round vote for the two major contenders by state. For comparison, you can switch to the 2018 and 2014 elections.
The complete results for all candidates at the municipal level are represented by Folha de S.Paulo and Globo.
U.S. Election Maps
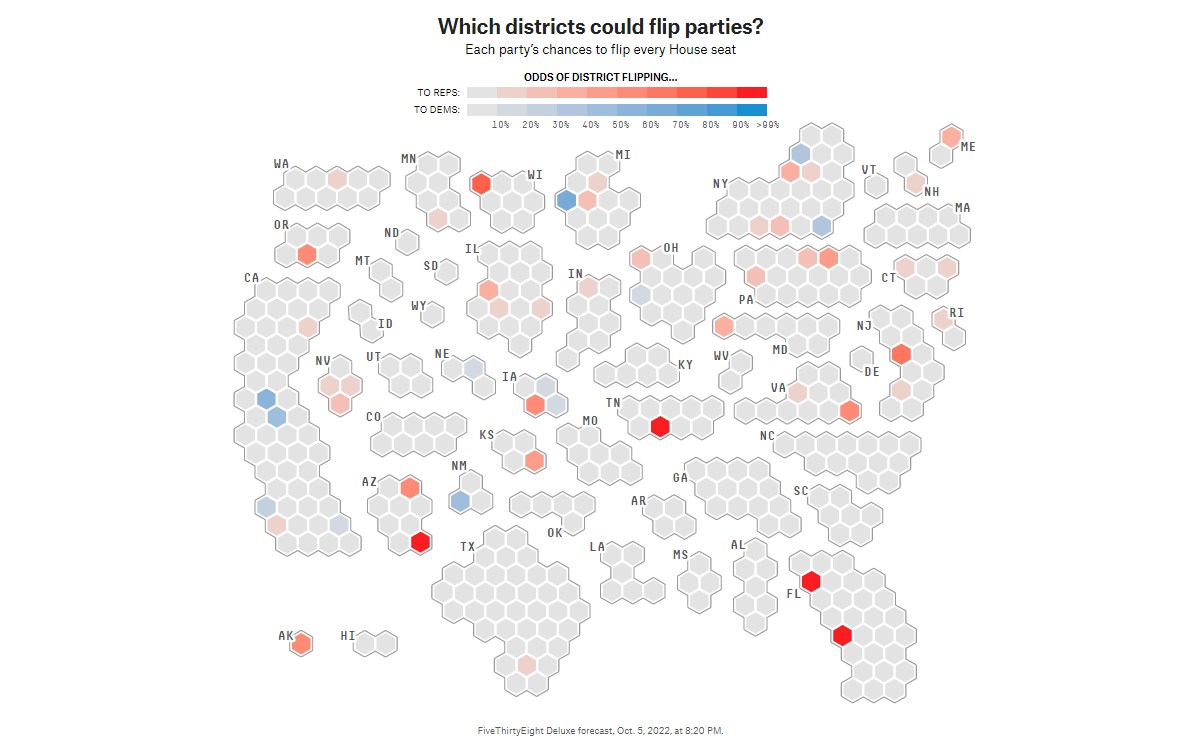
Less than one month is left until the 2022 United States midterm elections. Experts say chances are high that Republicans will win the U.S. House majority.
FiveThirtyEight offers a deep dive into its midterm forecast. To display the projections at a glance, a hexagonal cartogram is used. It represents which districts’ seats each party could actually flip this November.
A new season for the U.S. election maps has begun!
***
On DataViz Weekly, we curate the most interesting new data visualizations from around the web. Stay tuned for our roundups and don’t hesitate to tip us on awesome charts, maps, and infographics you produce and come across.
- Categories: Data Visualization Weekly
- No Comments »