Ukraine-Russia in Data Visualizations — DataViz Weekly
February 24th, 2023 by DataViz Weekly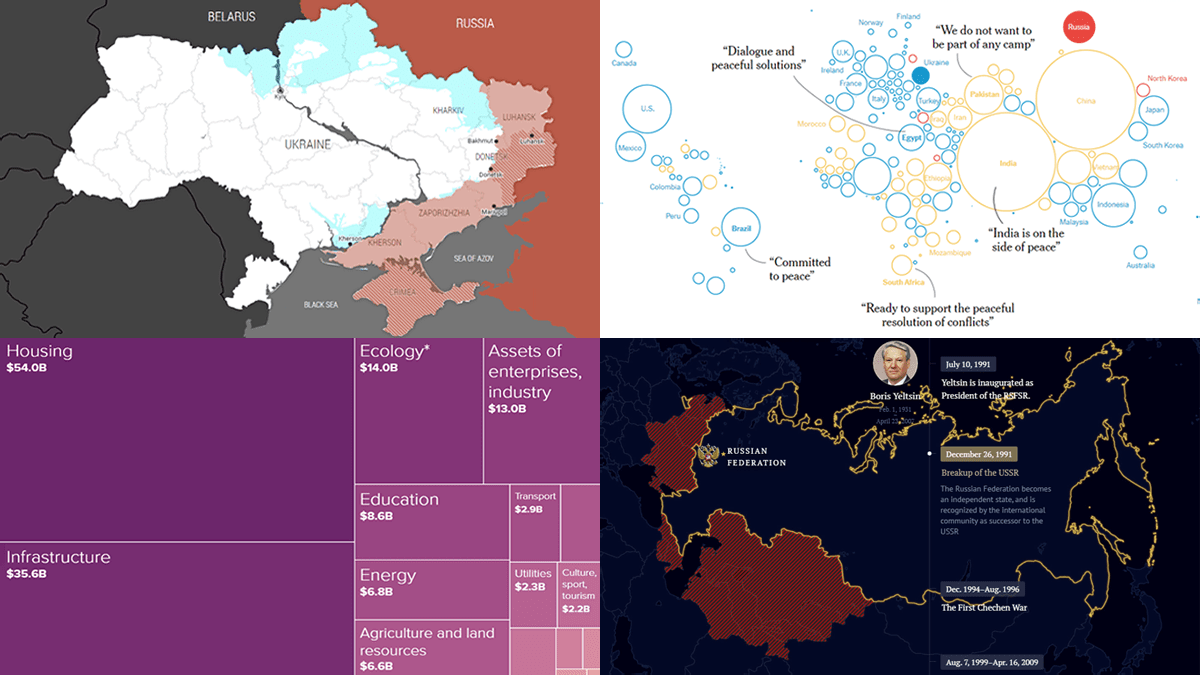 One year ago today, on February 24, 2022, Russia launched a massive attack on Ukraine. To mark this anniversary, DataViz Weekly has put together a collection of remarkable data visualizations that may offer insights into the conflict. These include Grid’s interactive that maps out how events unfolded over the last 365 days, Politico’s series of graphics that highlight some of the key numbers, The New York Times’s charts that illustrate the world’s stance, and Russia Beyond’s timeline of Russia’s territorial evolution since the 9th century.
- Categories: Data Visualization Weekly
- No Comments »
CEO Anton Baranchuk Receives 2023 DEVIES Award for AnyChart
February 16th, 2023 by AnyChart Team Last night was amazing: Anton Baranchuk, CEO and Co-founder of AnyChart, received our award for Best in Data Analytics and Visualization at DeveloperWeek’s DEVIES Awards ceremony in Oakland, California!
Check out some photos from the event in this quick story!
- Categories: AnyChart Charting Component, AnyGantt, AnyMap, AnyStock, Big Data, Business Intelligence, Financial Charts, Gantt Chart, GraphicsJS, HTML5, JavaScript, News, Qlik, Stock Charts
- No Comments »
Most Notable New Data Visualizations — DataViz Weekly
February 10th, 2023 by AnyChart Team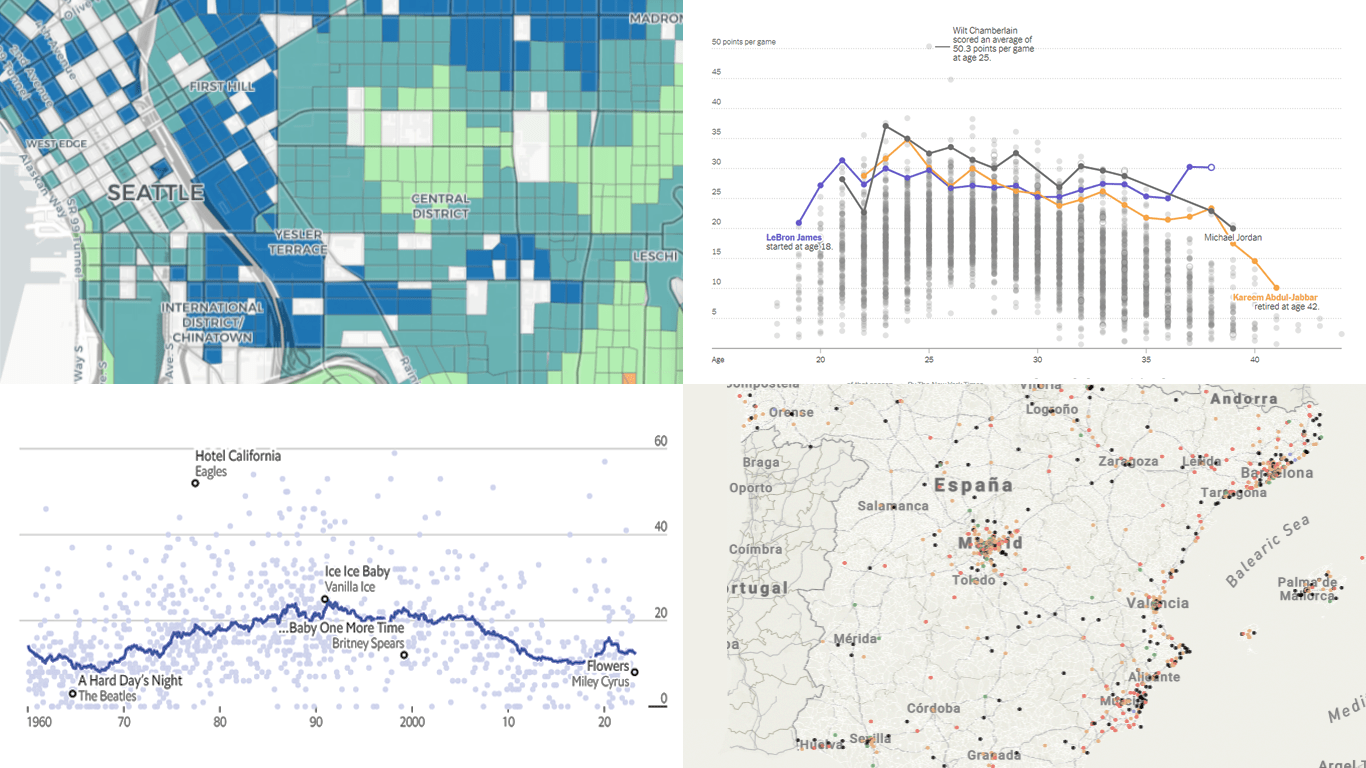 If you like cool data visualizations, DataViz Weekly is for you! In our new roundup, check out some of the most notable graphics we have seen around the web over the last seven days.
- Seattle as a 15-minute city — Nat Henry
- LeBron James vs the NBA’s other top scorers — The New York Times
- Subnational immigration patterns across Spain — El Confidencial
- Intro length in the top songs in 1960–2023 — The Economist
- Categories: Data Visualization Weekly
- No Comments »
AnyChart Named Best in Data Analytics & Visualization ?
February 3rd, 2023 by AnyChart Team We’re proud to announce that AnyChart has won a prestigious 2023 DEVIES Award in the Data Analytics & Visualization category! Many thanks to the jury and congratulations to all our partners and customers!
Celebrating 20 years in the market this year, we at AnyChart have been working hard to develop the best-in-class data visualization solutions. And we will keep innovating and excelling!
The DEVIES Awards are the definitive annual awards for the software industry, recognizing outstanding design, engineering, and innovation in developer technology across multiple categories. This year’s winners were selected from record-high hundreds of nominations by an expert-led panel of the DevNetwork Advisory Board, including representatives of Accenture, DigitalOcean, EA, Google, IBM, Salesforce, and other great companies.
- Categories: AnyChart Charting Component, AnyGantt, AnyMap, AnyStock, Big Data, Business Intelligence, Dashboards, Financial Charts, Gantt Chart, GraphicsJS, HTML5, JavaScript, News, Oracle Apex, Qlik, Stock Charts, Success Stories
- 2 Comments »