Nick Mar Uses AnyChart JS Charts to Visualize User Performance and Stock Market Data
April 24th, 2023 by AnyChart Team As the world’s top provider of cutting-edge data visualization solutions, we are constantly thrilled to witness how our products are utilized by both businesses and individuals to create interactive charts and dashboards. We recently had the opportunity to chat with software developer Nick Mar, who shared some of his personal projects with us, highlighting the use of AnyChart and his experience with our JavaScript charting library. Check out our interview with him! (Stack: HTML/CSS/JavaScript.)
- Categories: AnyChart Charting Component, HTML5, JavaScript, Success Stories
- No Comments »
Qlik Gantt & Sunburst’s Exciting New Features + Upgrades Across All Extensions!
April 18th, 2023 by AnyChart Team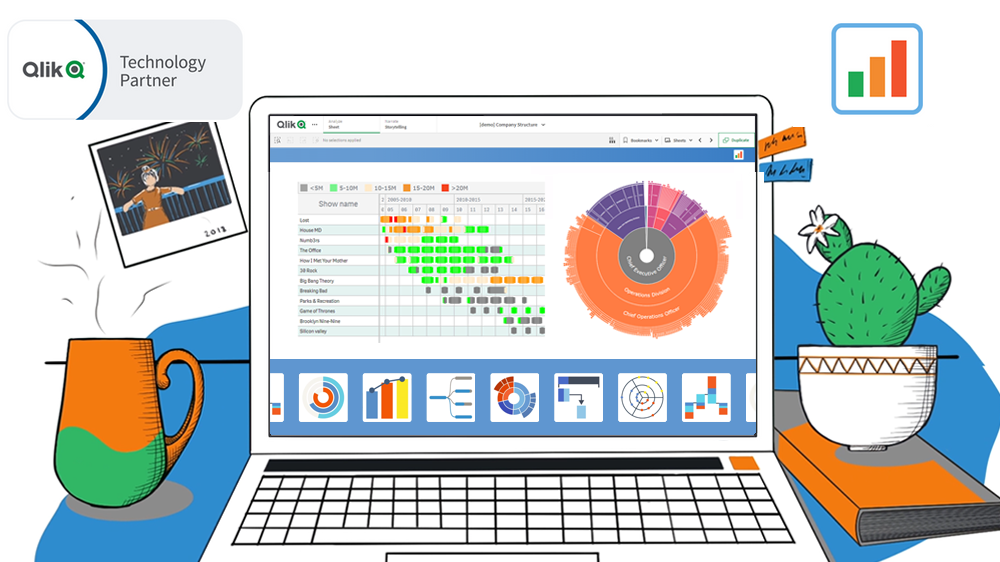 Hey Qlikkies! We have some exciting news to share with you today. AnyChart’s Qlik Sense Extensions have undergone a major update as we’ve made improvements across all of them, including the Decomposition Tree. However, we are particularly thrilled to announce the addition of some major features to our Sunburst Chart and Gantt Chart extensions.
But wait, there’s more! If you’re attending QlikWorld these days, we invite you to visit our team in Booth #180. There, you can try out the new features in action, ask questions, and learn more about how our extensions can improve your visual analytics experience in Qlik Sense. Don’t miss out on this chance to experience the AnyChart difference first-hand!
Our team has been hard at work, listening to your feedback and making improvements. We are confident that these new features will give you greater creative control and better performance in your Qlik-powered environment. So without further ado, let’s dive into the details of the major new upgrades!
Read more at qlik.anychart.com »
- Categories: AnyChart Charting Component, AnyGantt, Big Data, Business Intelligence, Dashboards, Gantt Chart, News, Qlik
- No Comments »
Join AnyChart at QlikWorld 2023: Sponsor & Exhibitor
April 14th, 2023 by AnyChart Team Get ready, because QlikWorld 2023 is coming in hot! From April 17th to 20th, Las Vegas will be bustling with all the latest and greatest in the world of data analytics, and AnyChart is pumped to be part of the action. Meet us in Booth #180!
Read more at qlik.anychart.com »
- Categories: AnyChart Charting Component, AnyGantt, Big Data, Business Intelligence, Dashboards, Gantt Chart, News, Qlik
- No Comments »
Building 3D Surface Plot in JavaScript
April 11th, 2023 by Awan Shrestha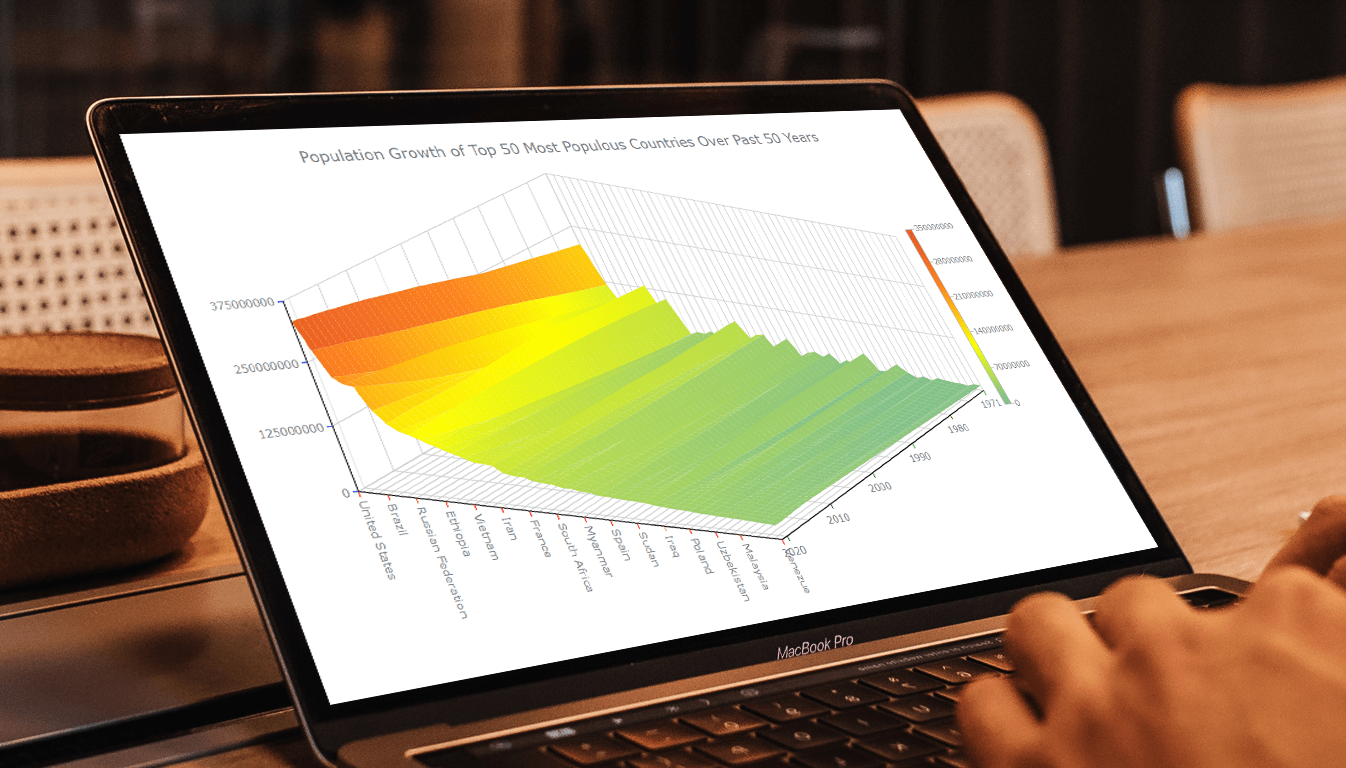 Welcome to this tutorial on creating a visually stunning and interactive 3D surface plot using JavaScript! If you’re passionate about data visualization and want to expand your skills to the next level, this guide is for you. Here, we’ll take you through a step-by-step process to create an engaging 3D surface plot that will make your data come alive.
Sometimes, representing complex information using traditional 2D charts can be difficult, especially when working with large datasets or data that varies over three or more dimensions. This is where a 3D surface plot (or surface chart) can prove to be useful. In this tutorial, we’ll be using real-world population data to create our surface plot, showcasing the population growth trends of the top 50 most populous countries in the world. You don’t need to be a data expert to follow this guide, as we’ll cover everything in detail.
So, sit back, grab your favorite beverage, and let’s dive into the world of data visualization with a 3D surface plot. By the end of this tutorial, you’ll have an impressive chart that you can showcase to your colleagues or friends. Let’s get started!
Read the JS charting tutorial »
- Categories: AnyChart Charting Component, Big Data, HTML5, JavaScript, JavaScript Chart Tutorials, Tips and Tricks
- No Comments »