AnyChart Triumphs Again: Awarded Best in Data Analytics and Visualization in 2024
February 19th, 2024 by AnyChart Team We are delighted to announce that AnyChart has won the prestigious 2024 DEVIES Awards in the Data Analytics & Visualization category, marking our victory for the second consecutive year!
The award celebrates our JavaScript charting library, continuously acknowledged as the world’s leading data visualization solution for developers. As AnyChart JS forms the cornerstone of our broader product line, this recognition once again highlights the technological excellence and innovation inherent in our entire suite of offerings, including the extensions for Qlik Sense.
- Categories: AnyChart Charting Component, AnyGantt, AnyMap, AnyStock, Big Data, Blogroll, Business Intelligence, Dashboards, Financial Charts, Gantt Chart, HTML5, JavaScript, News, Oracle Apex, Qlik, Stock Charts, Success Stories
- No Comments »
Introducing Updates to Waterfall Charts for Qlik Sense
February 1st, 2024 by AnyChart Team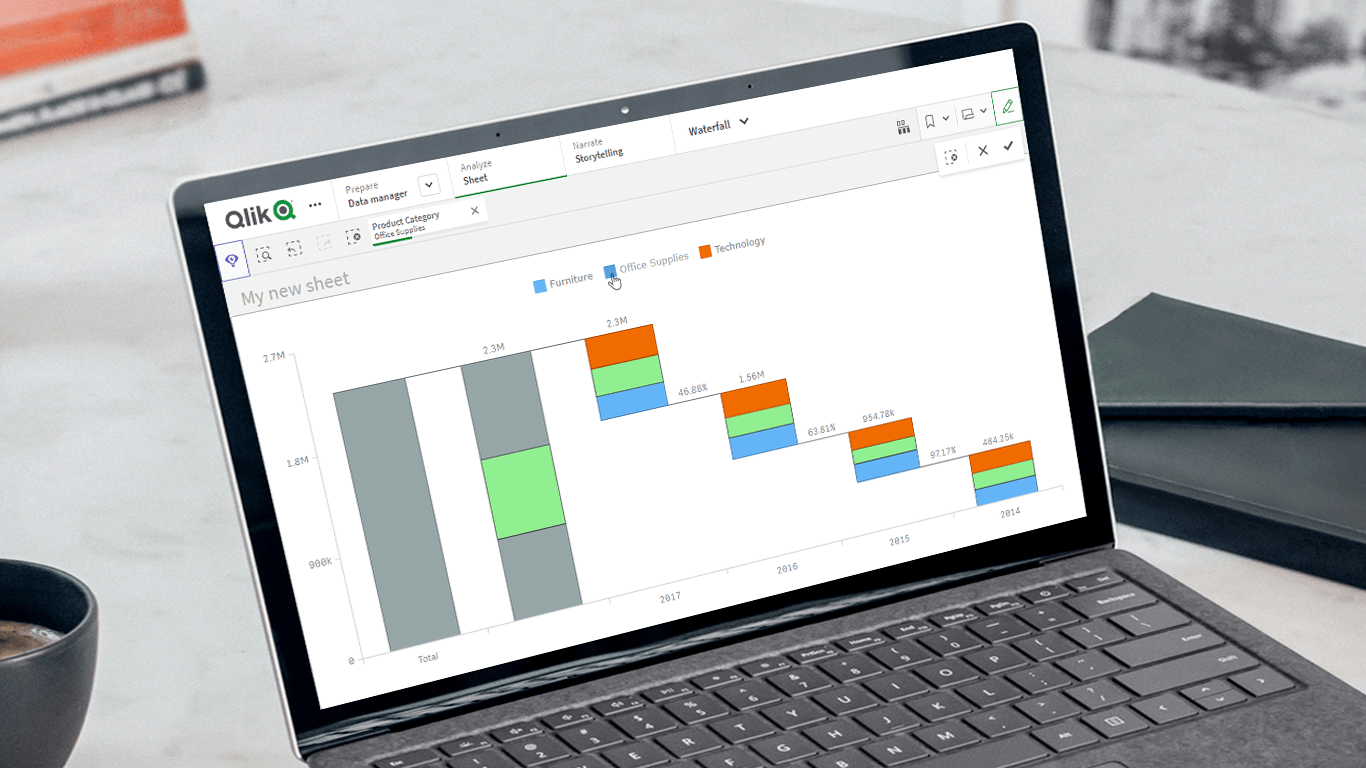 Unveiling the latest updates to our Waterfall Charts for Qlik Sense! In line with our commitment to empowering users to do more with Qlik, we’ve just added a set of new helpful features and improvements to our Waterfall Advanced and Waterfall Classic extensions. These enhancements are designed to further facilitate extracting valuable insights using stacked waterfall visualizations. Check out what’s in store!
Read more at qlik.anychart.com »
- Categories: Big Data, Business Intelligence, News, Qlik
- No Comments »