 Exploring minimalistic data presentation, this entry of JS Chart Tips shifts focus from complex visualizations to effectively showing raw numerical data. While our JavaScript charting library is designed to enable compelling graphical data displays, sometimes simplicity provides clearer insights. Reflecting on a recent customer request handled by our Support Team, now we’ll delve into how to display figures in a straightforward and direct way without creating any charts, offering a streamlined alternative that may be suitable in specific contexts.
Question: How to Visualize Figures Without Charts?
There are situations when you need to explicitly show just a raw figure, such as a key performance indicator. Recently, one of our customers requested help in creating a custom display that reveals only numerical values without any traditional data visualization elements like lines or bars. They needed a simple text-based presentation and provided an illustration of their basic concept, which looked somewhat like this:
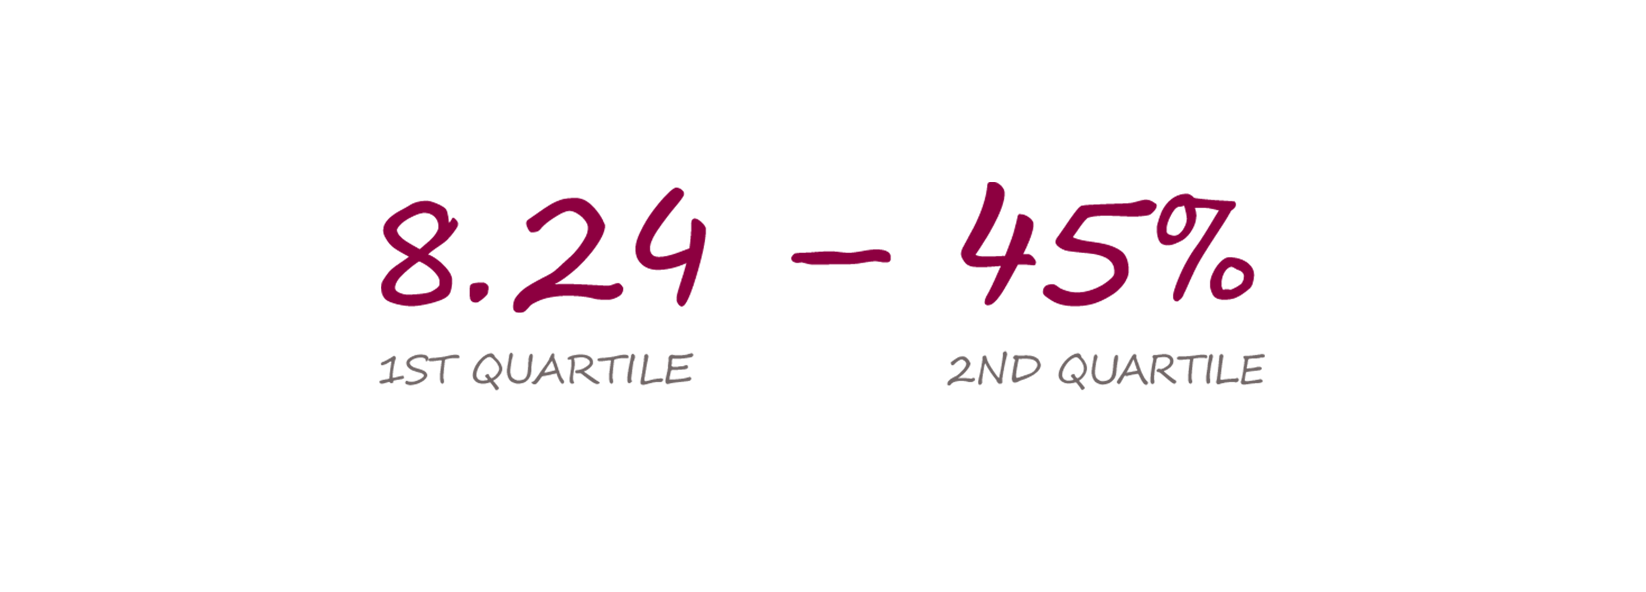
Keep reading to discover how to achieve this streamlined approach when a circular gauge or a linear gauge isn’t the preferred solution for that place in your dashboard and you need a purely text-based display.
Solution: Showing Figures in Text with No Chart
Overview
Whenever you need any custom visual not covered by our JS charting library’s out-of-the-box capabilities — especially when it’s not a chart at all — consider using AnyChart’s underlying graphics engine directly. We released it earlier as the open-source GraphicsJS library, and it can draw whatever you need.
To display figures as-is without lines, bars, and so on, utilize appropriate methods from the text API.
In Detail
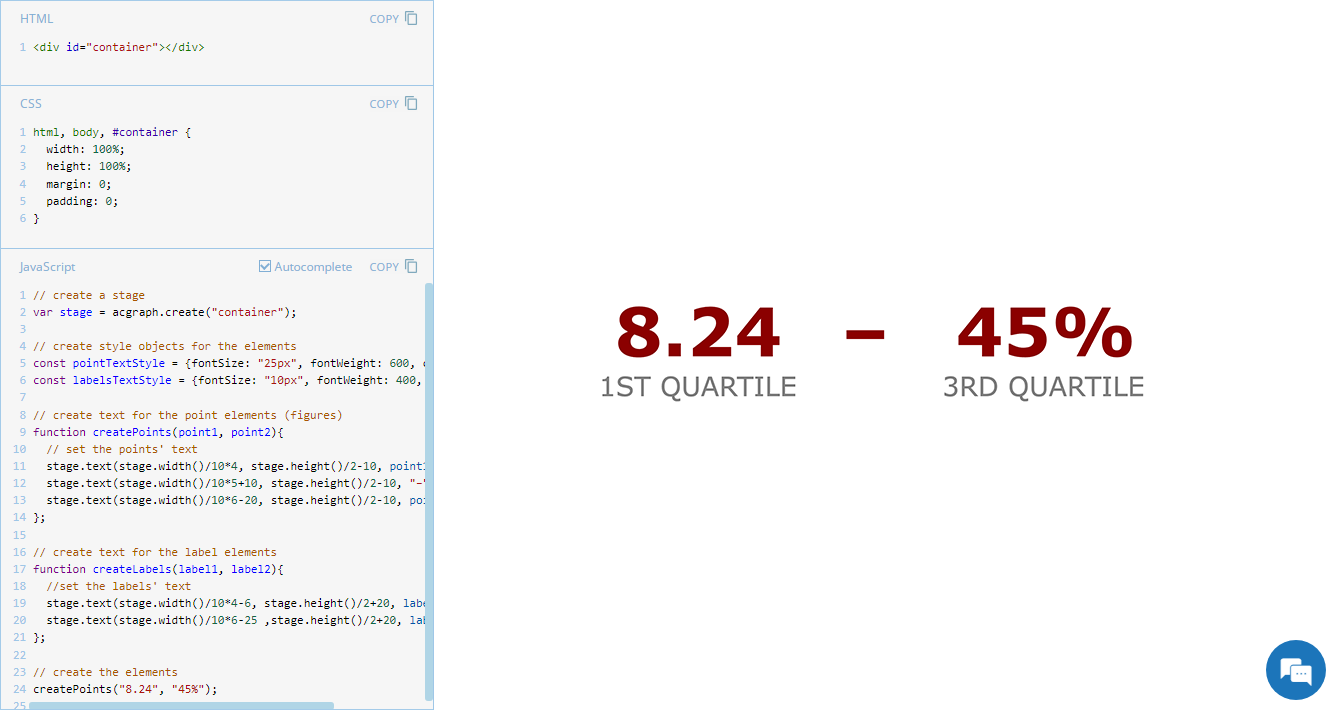
First, load the GraphicsJS library. If you are working with an HTML page, for instance, you can add it to the <head> section the following way:
<script src="https://cdn.anychart.com/releases/8.12.1/js/graphics.min.js"></script>Second, set a stage using the acgraph.create() method:
var stage = acgraph.create("container");Third, create style objects for the elements you need. For instance, that customer wanted to display figures (numbers) with a text label. In a similar situation, create two objects:
const pointTextStyle = {fontSize: "25px", fontWeight: 600, color: "darkred"};
const labelsTextStyle = {fontSize: "10px", fontWeight: 400, color: "gray"};
Fourth, create a function to define each type of element:
// create text for the point elements (figures)
function createPoints(point1, point2){
  // set the points' text
  stage.text(stage.width()/10*4, stage.height()/2-10, point1, pointTextStyle);
  stage.text(stage.width()/10*5+10, stage.height()/2-10, "–", pointTextStyle);
  stage.text(stage.width()/10*6-20, stage.height()/2-10, point2, pointTextStyle)
};

// create text for the label elements
function createLabels(label1, label2){
  // set the labels' text
  stage.text(stage.width()/10*4-6, stage.height()/2+20, label1, labelsTextStyle);
  stage.text(stage.width()/10*6-25 ,stage.height()/2+20, label2, labelsTextStyle)
};
Fifth, create the elements:
createPoints("8.24", "45%");
createLabels("1ST QUARTILE", "3RD QUARTILE");
Check out how the JavaScript part of the code can look altogether:
// create a stage
var stage = acgraph.create("container");

// create style objects for the elements
const pointTextStyle = {fontSize: "25px", fontWeight: 600, color: "darkred"};
const labelsTextStyle = {fontSize: "10px", fontWeight: 400, color: "gray"};

// create text for the point elements (figures)
function createPoints(point1, point2){
  // set the points' text
  stage.text(stage.width()/10*4, stage.height()/2-10, point1, pointTextStyle);
  stage.text(stage.width()/10*5+10, stage.height()/2-10, "–", pointTextStyle);
  stage.text(stage.width()/10*6-20, stage.height()/2-10, point2, pointTextStyle)
};

// create text for the label elements
function createLabels(label1, label2){
  // set the labels' text
  stage.text(stage.width()/10*4-6, stage.height()/2+20, label1, labelsTextStyle);
  stage.text(stage.width()/10*6-25 ,stage.height()/2+20, label2, labelsTextStyle)
}

// create the elements
createPoints("8.24", "45%");
createLabels("1ST QUARTILE", "3RD QUARTILE");
Example
Check out an example of a no-chart data visualization, displaying figures with labels, and feel free to experiment further with the code and visualization:

Further Learning
Learn more about creating custom standalone text displays in the documentation:
Wrapping Up
For further questions or assistance, please leave a comment below or reach out directly to our Support Team.
Keep up with our JavaScript Chart Tips series for more practical tips and solutions drawn from actual support scenarios.
Enjoy visualizing data with JavaScript!
- Categories: AnyChart Charting Component, Dashboards, GraphicsJS, HTML5, JavaScript, JS Chart Tips, Tips and Tricks
- No Comments »