 Annotations in charts, such as shapes or text markers, can greatly enhance data narratives by providing more context directly on the visual plane. Thus, it’s no surprise that the ability to add them is one of the most sought-after features of our JavaScript charting library. Although typically used in stock charts, annotations can be just as effective in standard graphics for highlighting specific data points or trends. In this edition of JS Chart Tips, you’ll learn how to add annotations to a basic line chart.
Question: How to Add Annotations to Line Chart?
Some time ago, our Support Team received a quick message via the live chat attached throughout our website (you can find it in the bottom right corner — feel free to ask anything anytime). The customer wondered whether annotations are supported in conventional line charts. Although no picture was attached, we assumed the request was for something like this:
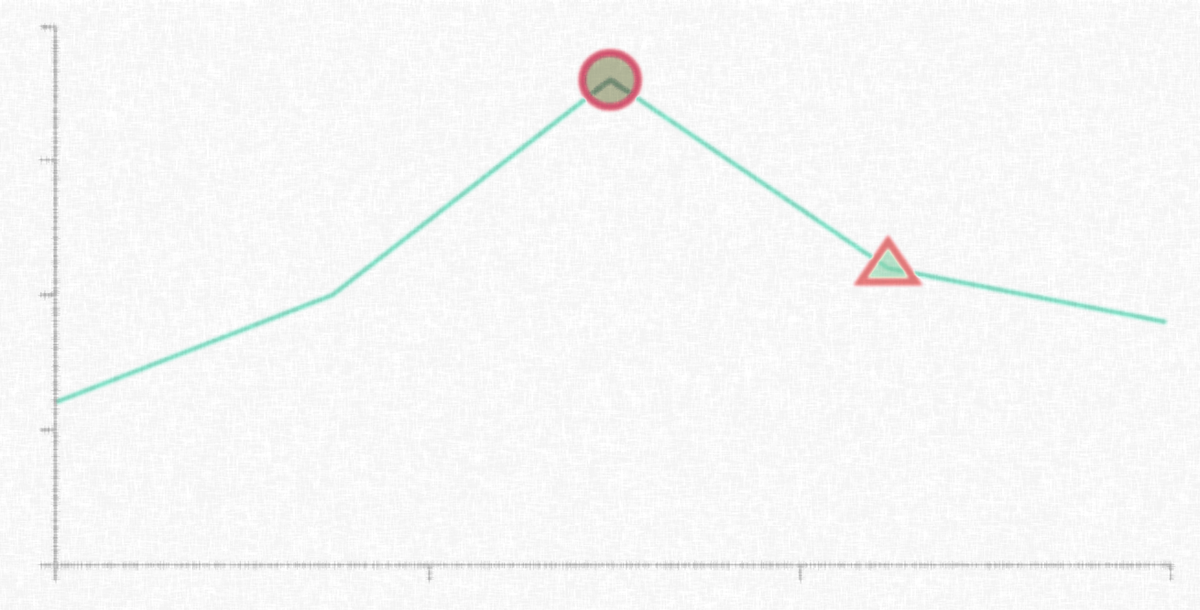
It took just a few minutes to provide the customer with helpful links to the documentation and an illustrative example on AnyChart Playground. We now invite you to see in detail how annotations can be added to your own non-stock line charts.
Solution: Displaying Annotations in JS Line Chart
Overview
After creating a line chart, as well as after building any other chart using our JS charting library, you can add an annotation to it with the help of the dedicated module.
In Detail
First, access the annotations() object:
var controller = chart.annotations();Second, create a desired annotation using an appropriate method depending on the type of annotation you want to display: ellipse(), rectangle(), triangle(), etc. For instance:
var triangle = controller.triangle();Third, configure the annotation by using the xAnchor(), valueAnchor(), secondXAnchor(), and secondValueAnchor() methods inside the employed annotation type method to set two anchor points determining the position and size of the annotation. You can also customize the appearance as per your needs and preferences:
var triangle = controller.triangle({
  xAnchor: "1.5",
  valueAnchor: 45,
  secondXAnchor: "2.6",
  secondValueAnchor: 62,
  fill: {opacity: 0},
  stroke: "2 red"
});
Here’s what the entire code for such an annotation can look like when all the previous snippets are combined:
// access the annotations() object
var controller = chart.annotations();

// create and configure an annotation
var triangle = controller.triangle({
  xAnchor: "1.9",
  valueAnchor: 17,
  secondXAnchor: "2.1",
  secondValueAnchor: 19,
  fill: "#4CAF50 0.5",
  stroke: "3 #FF9800"
});
Alternatively, you can work with the annotations() object using the literal syntax notation instead of function constructors. Here’s how it can look:
chart.annotations([
  {
    type: "triangle",
    xAnchor: 1.9,
    valueAnchor: 17,
    secondXAnchor: 2.1,
    secondValueAnchor: 19,
    fill: "#4CAF50 0.5",
    stroke: "3 #FF9800"
  }
]);
Example
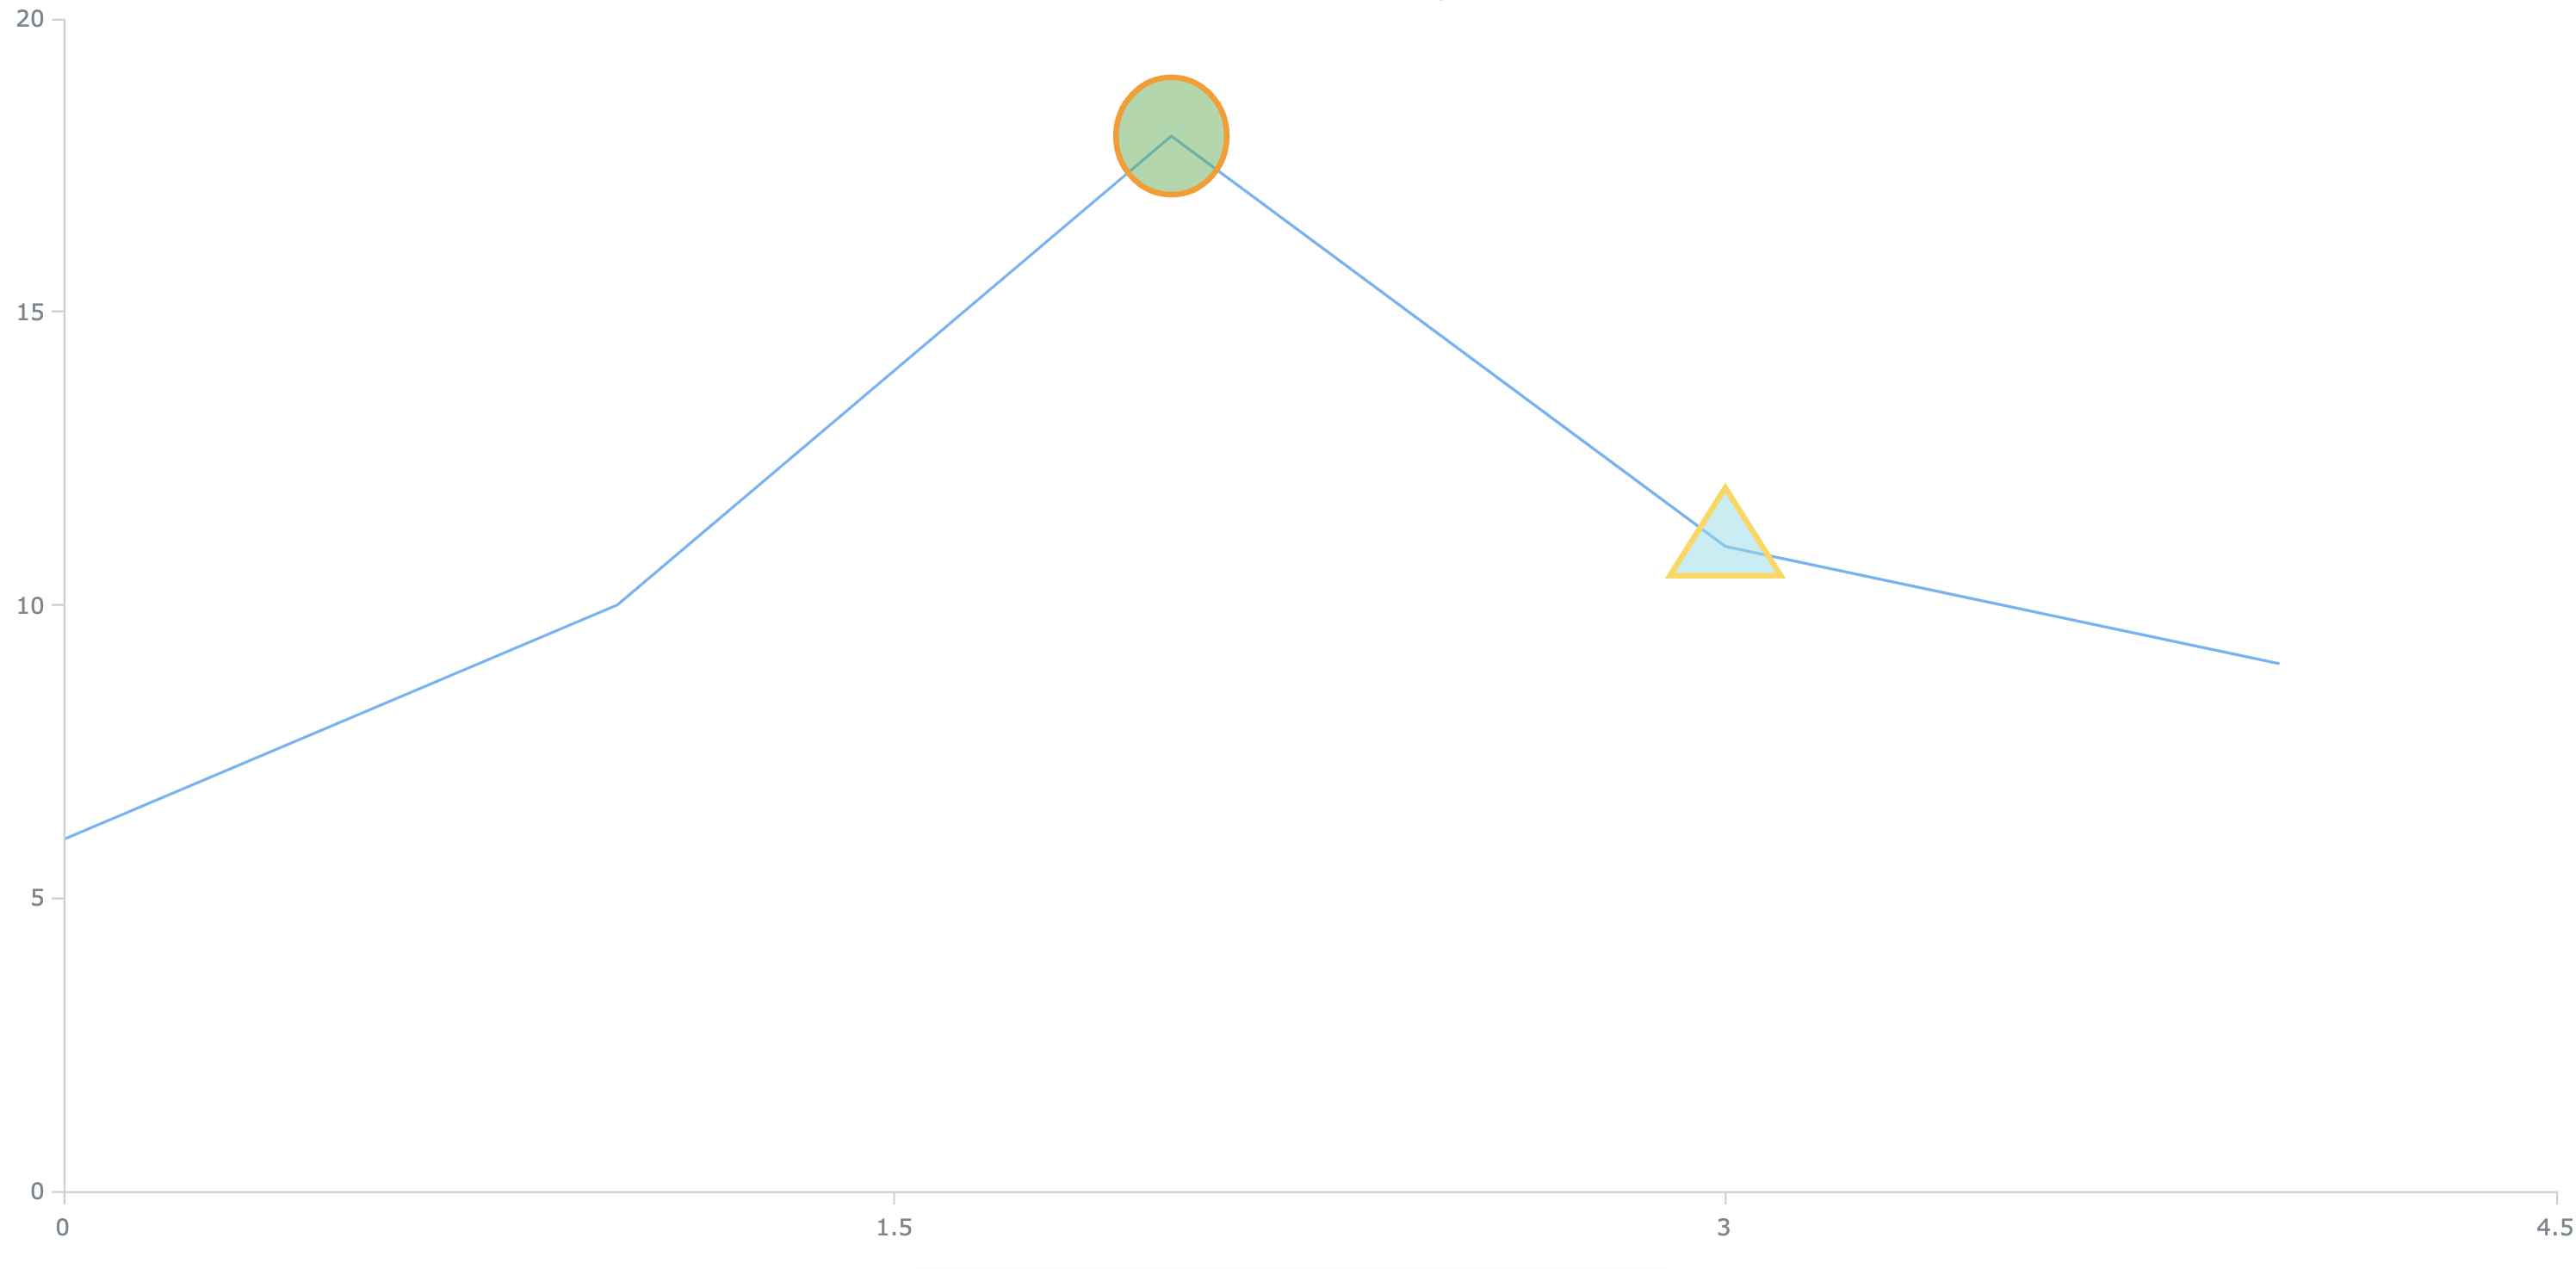
Check out an example of a JS line chart with two annotations, a triangle and an ellipse, and feel free to experiment further with its code and visualization:
Further Learning
Learn more about adding and customizing annotations in our JavaScript charting docs, with links to the articles explaining how to configure each type of annotation, illustrated with relevant chart examples:
Wrapping Up
For any queries or further assistance, please feel free to comment or contact our Support Team.
Continue following our JavaScript Chart Tips series for more insights and techniques inspired by real customer cases.
Happy coding and charting with JavaScript!
- Categories: AnyChart Charting Component, Charts and Art, HTML5, JavaScript, JS Chart Tips, Tips and Tricks
- No Comments »