New Interesting Data Visualization Examples to Check Out — DataViz Weekly
December 13th, 2024 by AnyChart Team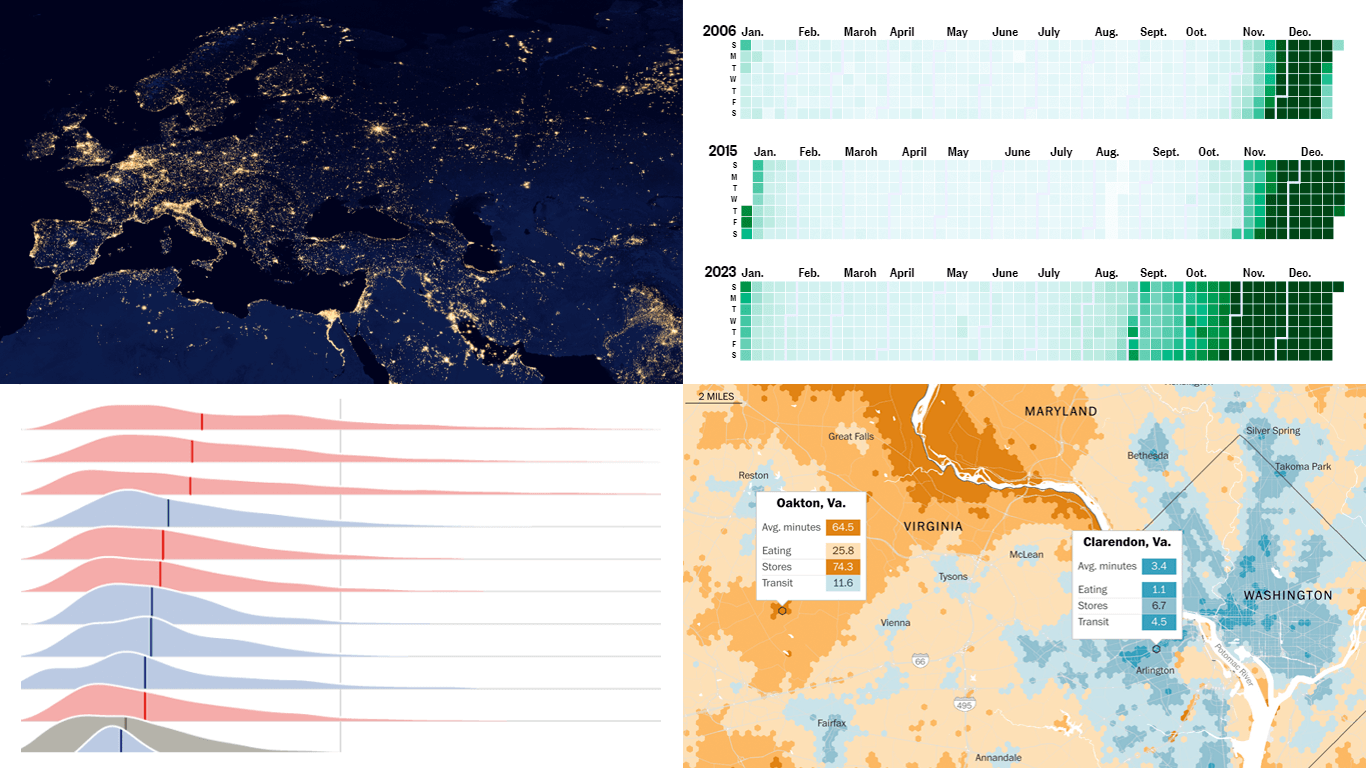 Curious about what’s new and interesting in the world of data visualization? DataViz Weekly brings you a selection of projects with charts and maps that have caught our attention lately. Here’s what’s lined up this time:
- Threats of light and noise pollution to aquatic ecosystems — AquaPLAN
- 15-minute accessibility in urban areas — The Washington Post / Sony CSL
- Shifting popularity of “All I Want for Christmas Is You” — NBC News
- Taylor Swift’s Eras Tour resale ticket prices — The Economist
- Categories: Data Visualization Weekly
- No Comments »
Recent Data Visualization Projects Worth Exploring — DataViz Weekly
December 6th, 2024 by AnyChart Team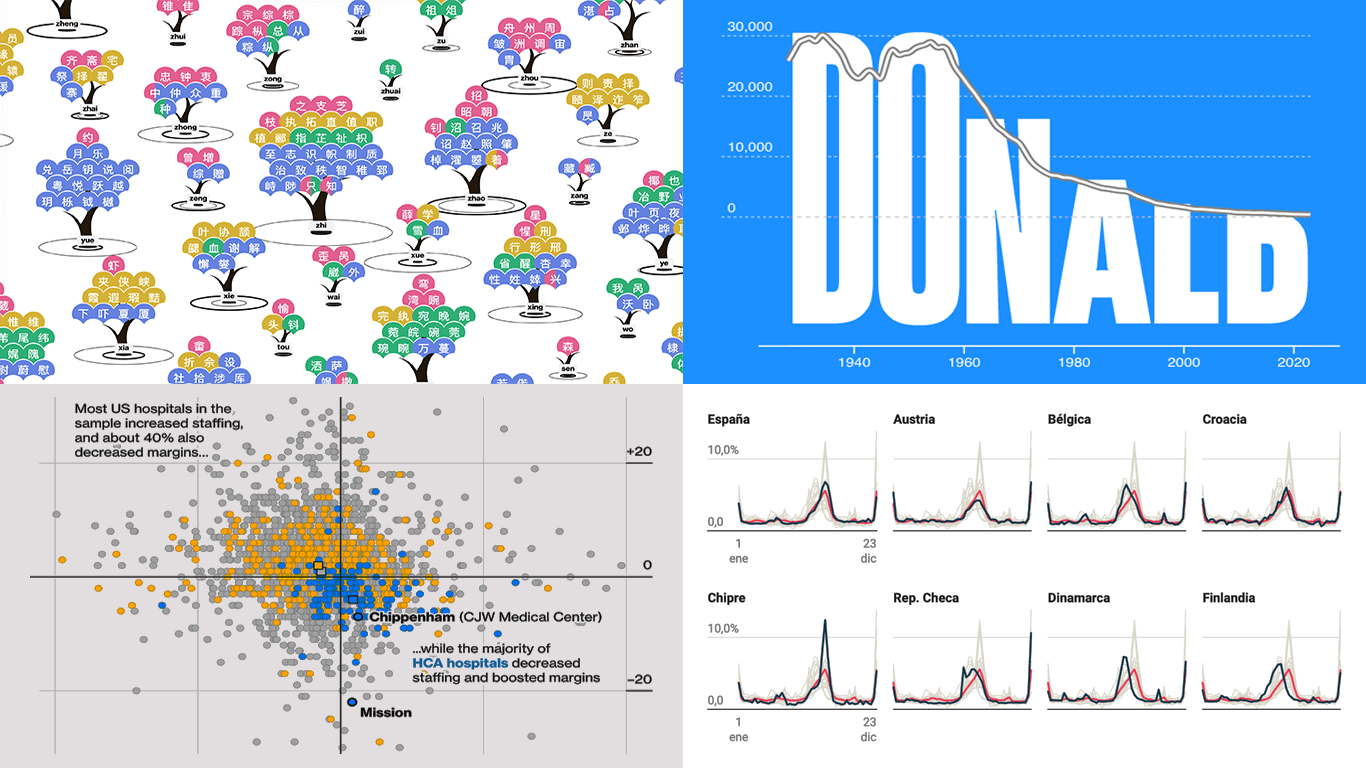 Data visualization makes complex information accessible and insightful, serving as a valuable tool for both analysis and communication. This edition of DataViz Weekly features four recent projects that showcase its application across diverse topics.
- Chinese name complexity in Pinyin translation — CSH
- Name popularity visualized through letter size — Jetpack.AI
- Nurse practitioner risks and HCA Healthcare — Businessweek
- Temporal vacation trends across Europe — El Confidential
- Categories: Data Visualization Weekly
- No Comments »
Integrating AnyChart JS Charts in Python Django Financial Trading Dashboard
December 3rd, 2024 by Michael Whittle We are pleased to share an insightful article by Michael Whittle, a seasoned solution architect and developer with over 20 years of experience. Originally published on EODHD.com, it explores how he integrated our JavaScript charting library into a financial trading dashboard built with Python Django. Michael also shares his experience migrating a treemap from D3.js to AnyChart and explains why he chose our solution for implementing a stock chart, highlighting the intuitive code and enhanced functionality. Read on to discover how you can elevate your financial data visualizations in Python Django web applications with AnyChart JS Charts.
- Categories: AnyChart Charting Component, AnyStock, Big Data, Dashboards, Financial Charts, HTML5, JavaScript, Stock Charts, Third-Party Developers, Tips and Tricks
- No Comments »