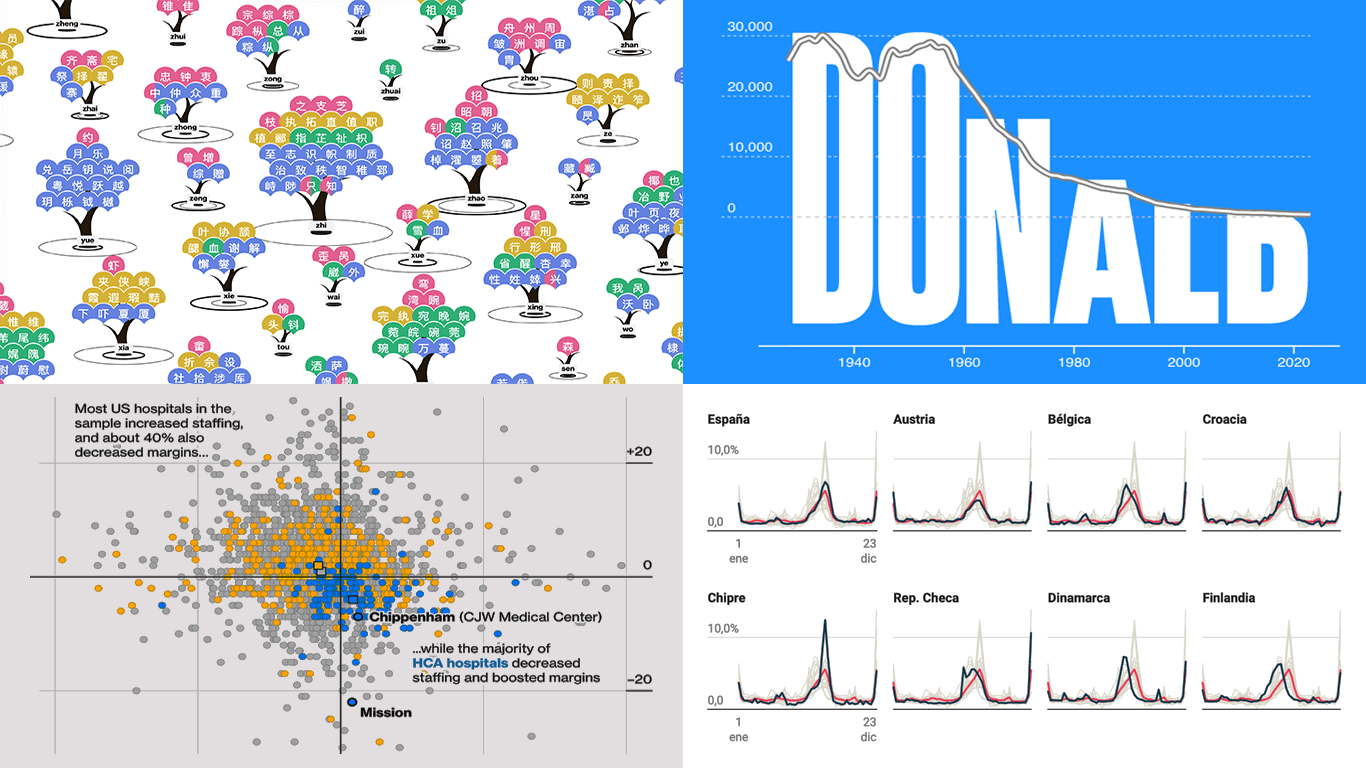
 Data visualization makes complex information accessible and insightful, serving as a valuable tool for both analysis and communication. This edition of DataViz Weekly features four recent projects that showcase its application across diverse topics.
- Chinese name complexity in Pinyin translation — CSH
- Name popularity visualized through letter size — Jetpack.AI
- Nurse practitioner risks and HCA Healthcare — Businessweek
- Temporal vacation trends across Europe — El Confidential
Data Visualization Weekly: November 29, 2024 — December 6, 2024
Chinese Name Complexity in Pinyin Translation
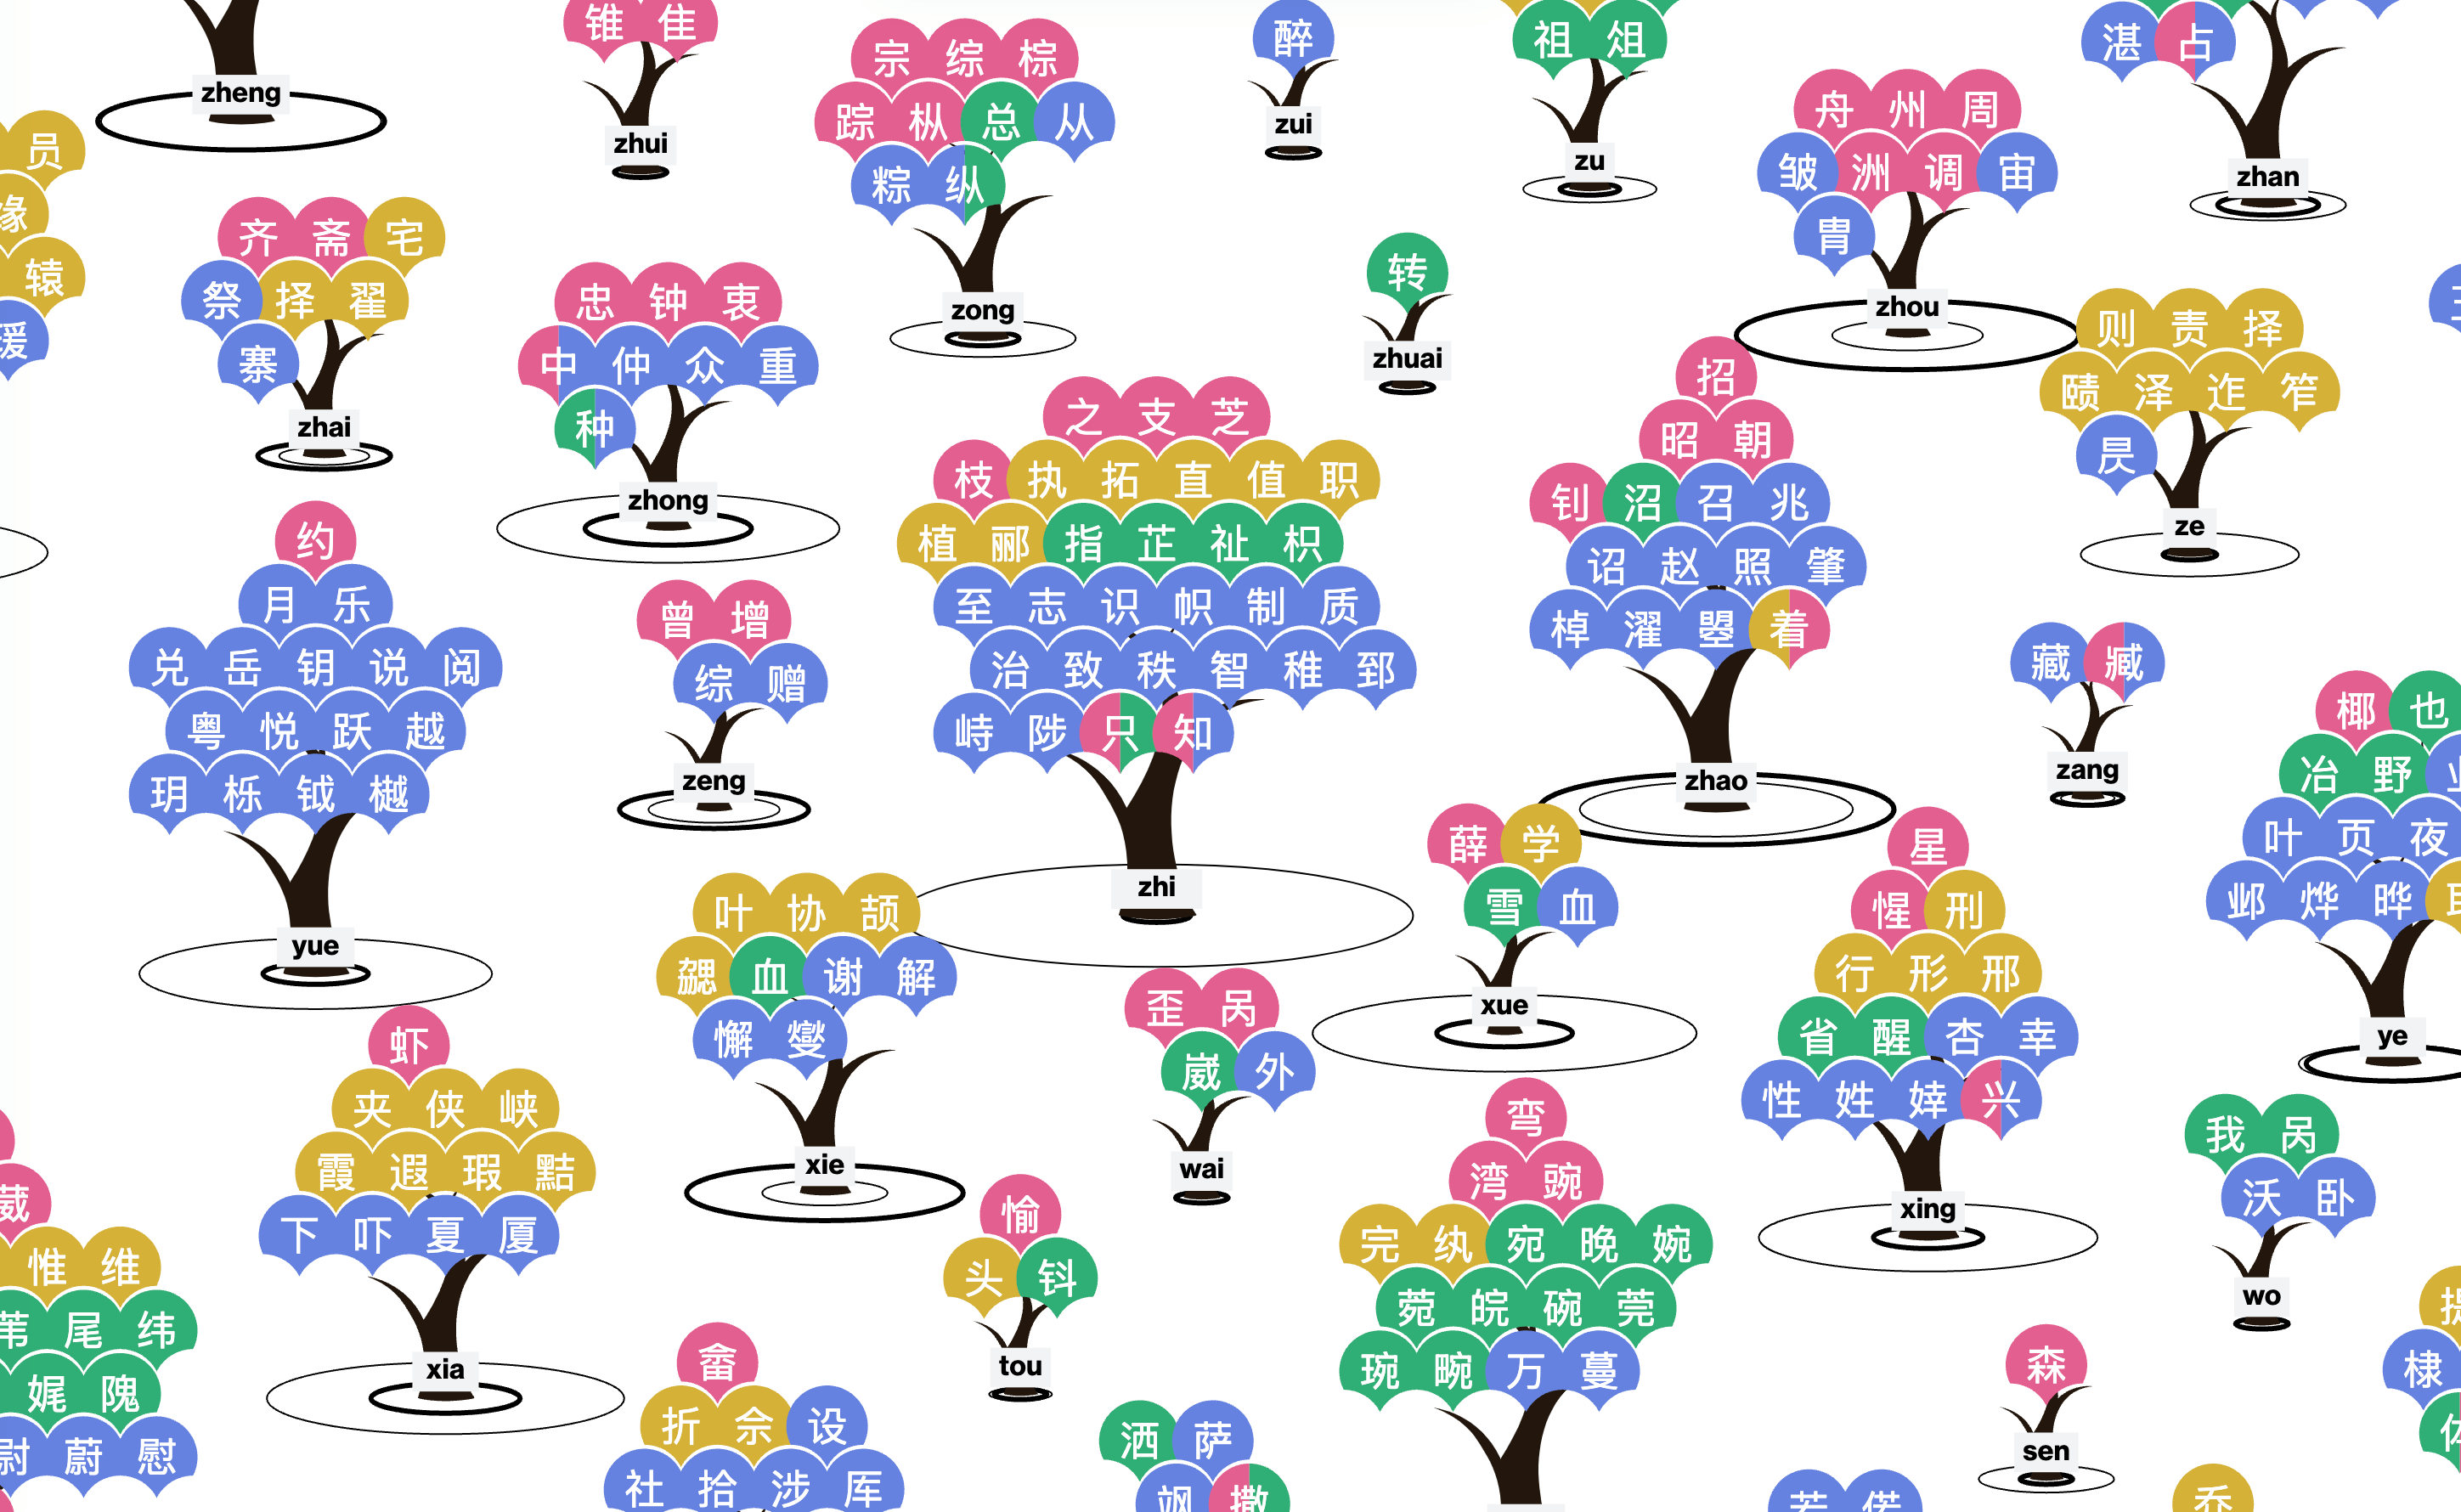
Chinese names are commonly written in Hanyu Pinyin — a system that romanizes Mandarin pronunciation. However, while Pinyin helps with pronunciation, it can obscure the original Chinese characters and their meanings. Even native speakers may find it challenging to pinpoint the exact written names due to tonal nuances and overlapping Pinyin spellings.
Liuhuaying Yang from the Complexity Science Hub (CSH) illustrates these challenges with a project visualizing the complexity of Chinese names. Using interactive trees, it shows how a single Pinyin version can correspond to multiple distinct Chinese names. You can click on branches to hear tonal differences, gaining a unique understanding of Chinese naming conventions and the intricacies hidden behind romanized spellings.
Discover the project on the CSH website.
Name Popularity Visualized Through Letter Size
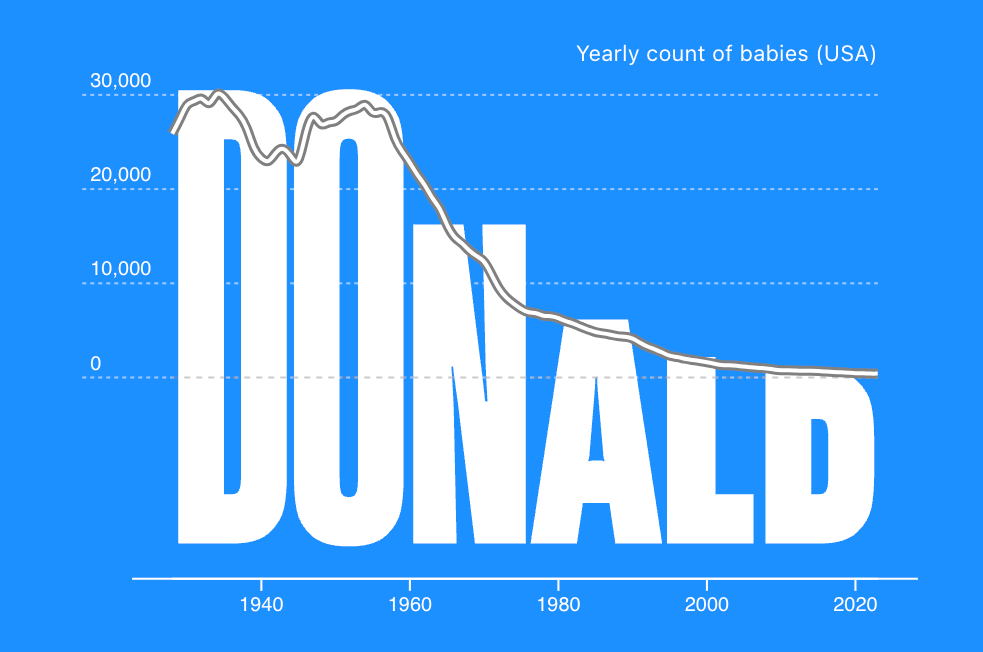
Baby name trends have inspired many visualizations. This project offers a new and creative perspective.
Karim Douïeb of Jetpack.AI introduces a tool that visualizes baby name popularity by adjusting each letter’s height based on its trend line over time. Users can explore data from the United States (SSA data) and France (Insee data). The tool is customizable — change colors, hide the line graph to focus purely on the typographic transformation, and easily share the resulting image.
Play with the tool on Jetpack.AI’s website.
Nurse Practitioner Risks and HCA Healthcare
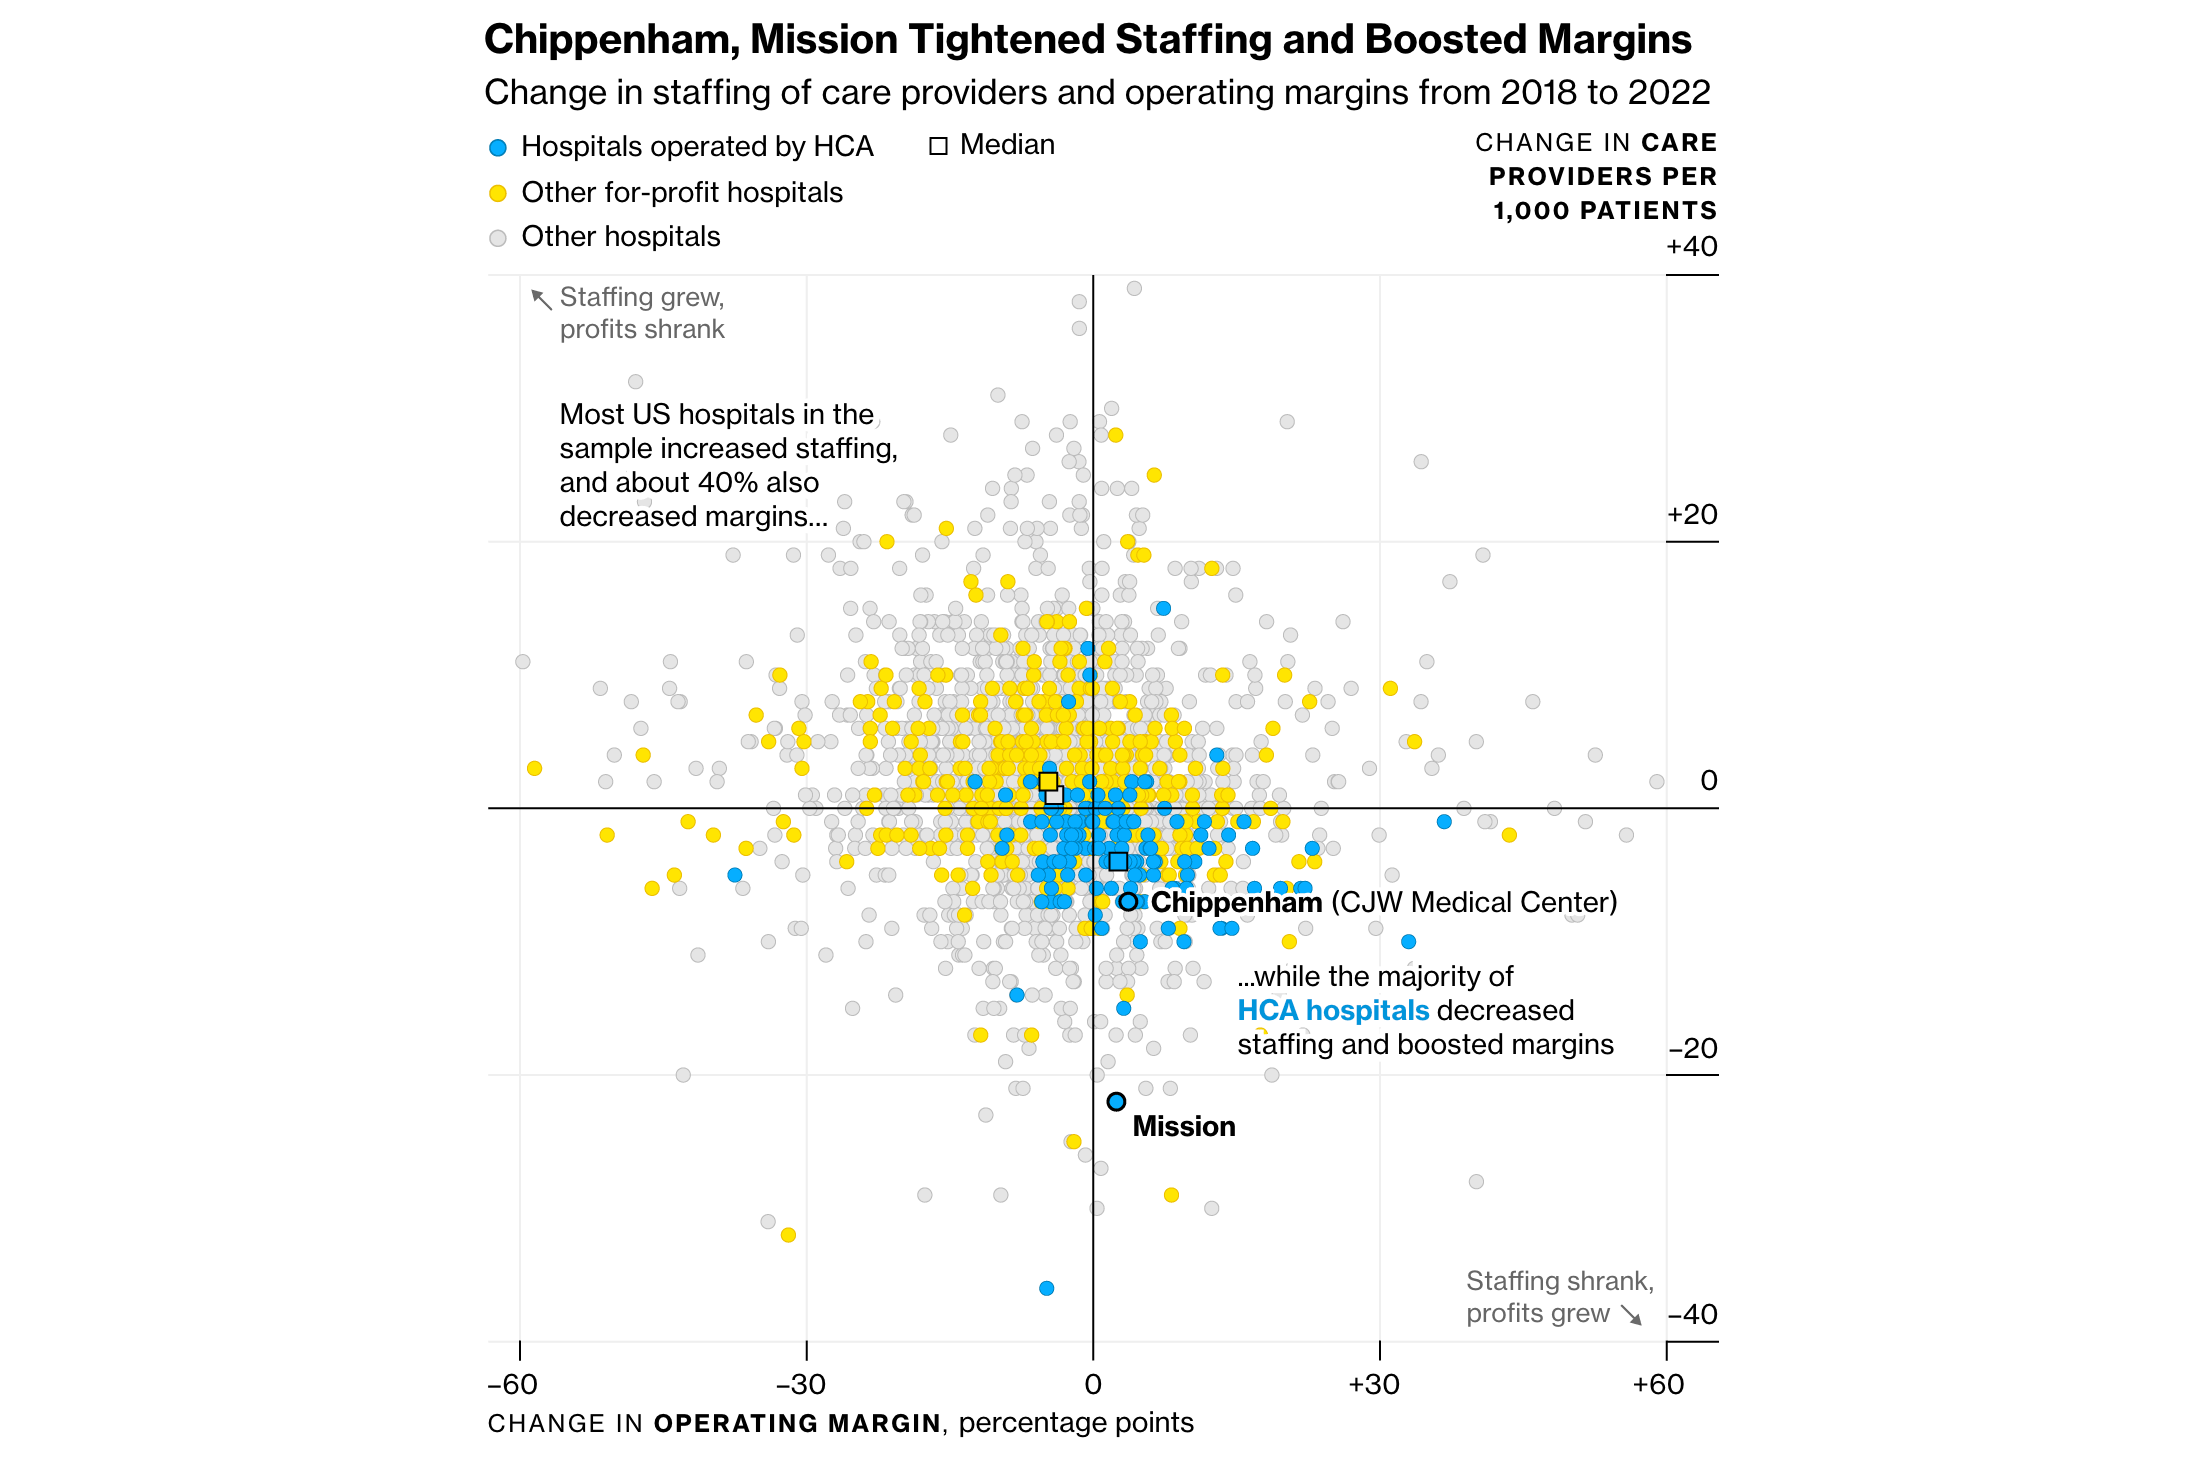
Nurse practitioners (NPs) are increasingly taking on primary patient care duties, including roles in specialty practices and emergency rooms. While this can improve access to care, it may also involve risks.
Bloomberg Businessweek’s ongoing investigative series “The Nurse Will See You Now” examines the implications of this trend. In the second installment, authored by Caleb Melby and Noah Buhayar, the focus turns to HCA Healthcare Inc., the largest U.S. hospital chain valued at $84 billion. Like many others, HCA’s hospitals have increasingly assigned NPs to more critical roles. The article highlights several reported patient deaths allegedly linked to NP-led care, underscoring the potential dangers. Accompanying data visualizations contextualize HCA’s practices within the broader U.S. healthcare landscape. For instance, the scatter plot you see above compares staffing and operating margin changes from 2018 to 2022 across U.S. hospitals, revealing that while most U.S. hospitals increased staffing and over a third decreased margins, most HCA hospitals reduced staffing and increased margins.
Check out the article on Businessweek.
Temporal Vacation Trends Across Europe
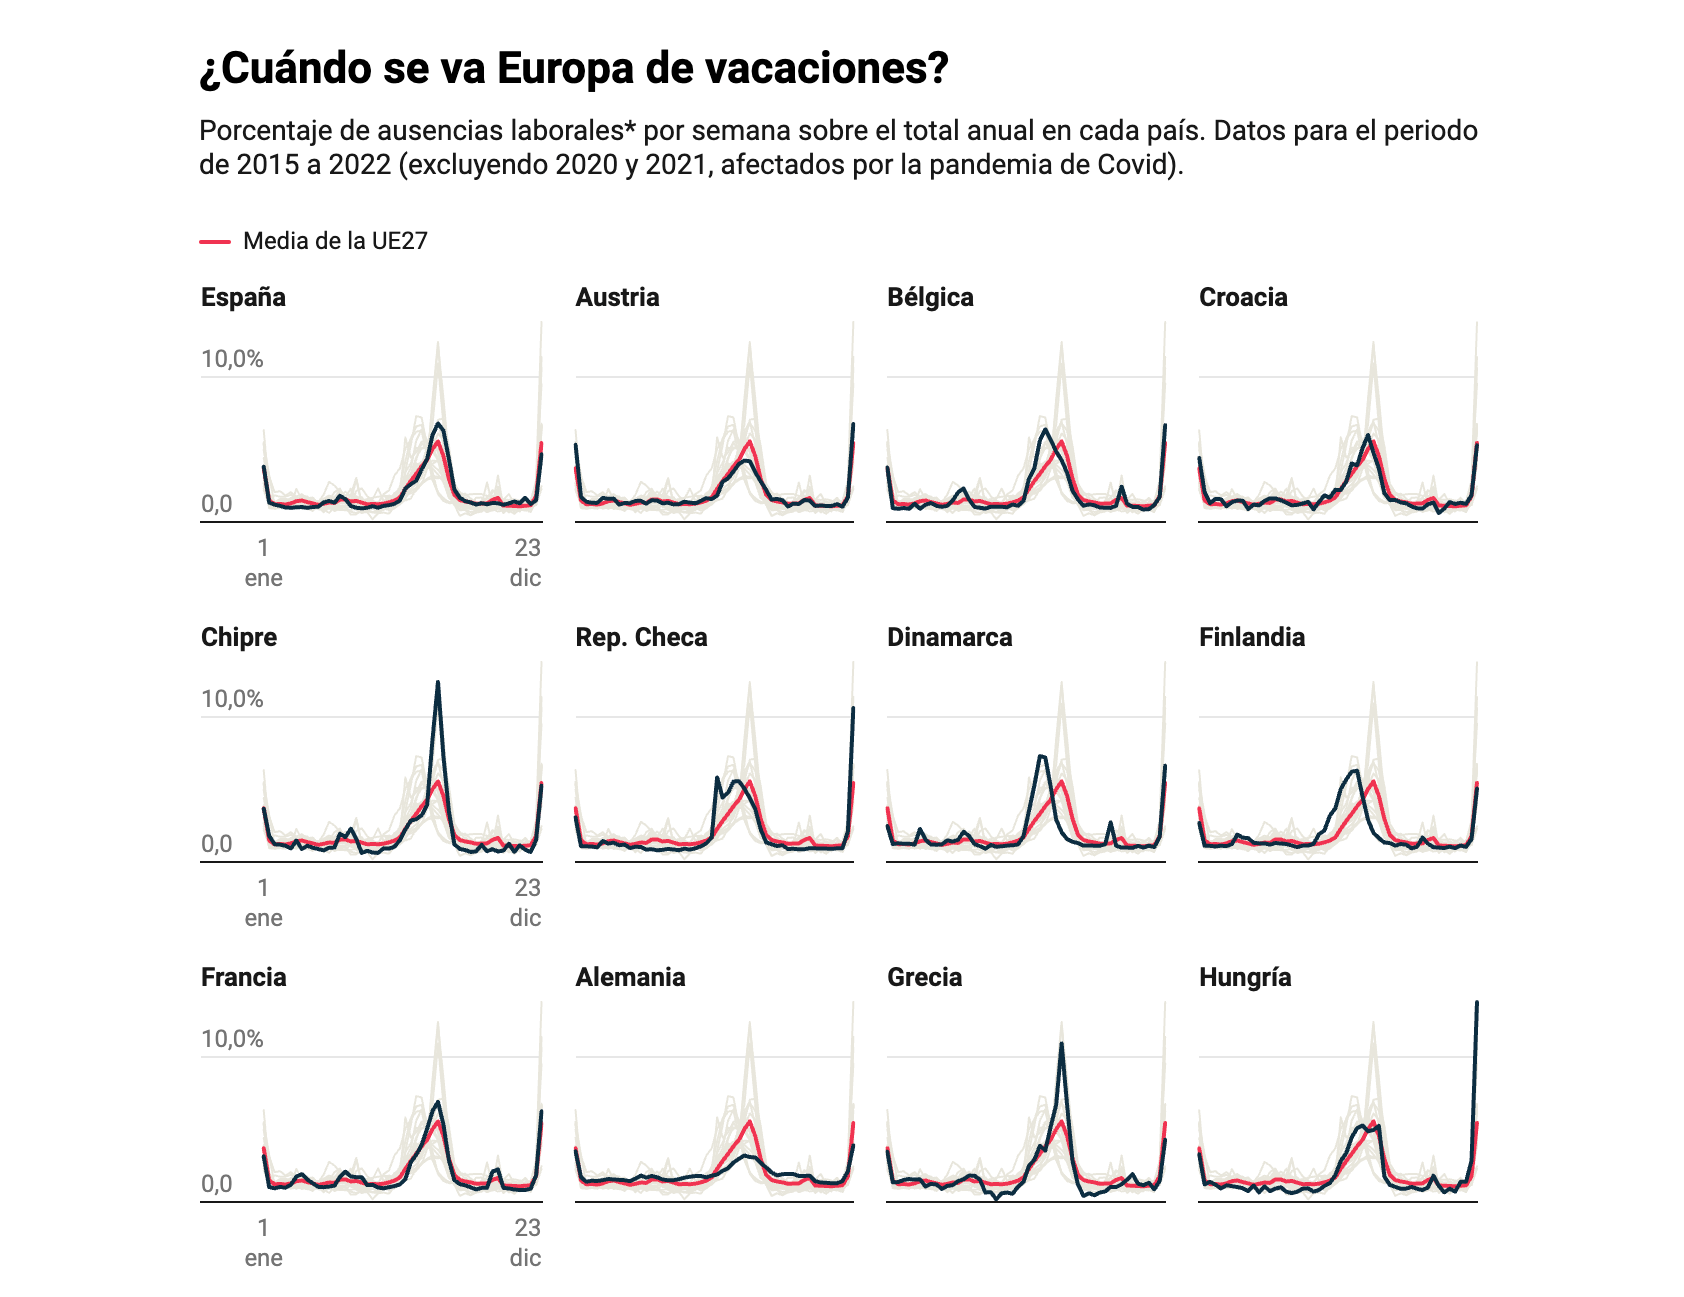
Vacation habits in Europe vary significantly by country, reflecting a spectrum of cultural and regional practices. Analyzing weekly labor absence data provides a unique perspective on when and how holiday periods are distributed across the continent.
El Confidencial uses Eurostat data to present line charts comparing weekly labor absences as a percentage of each country’s annual total from 2015 to 2022. These time-series charts are paired with a choropleth map, offering a broad regional overview. The article also examines Spain’s internal tourism shifts using data from the Spanish Statistical Office (INE). Stacked area charts illustrate how domestic tourist hotel stays in Benidorm, Sanxenxo, and Gandia have evolved from 2005 to 2023.
Explore the analysis on El Confidencial — by Marta Ley, Filippo Sconza, Petr Jedlička, and Eva Papadopoulou.
Wrapping Up
Thanks for joining us on this Data Visualization Weekly journey. Stay tuned for more compelling data viz examples curated from around the web — our next issue is coming in a week!
- Categories: Data Visualization Weekly
- No Comments »