 DataViz Weekly is here with a spotlight on new charts and maps that do a great job of turning data into meaningful insights. Today, we invite you to explore the following projects, each demonstrating how data visualization helps reveal patterns, tell stories, and deepen understanding:
- European electricity transition — Ember
- The United States vs. China on global trade — Lowy Institute
- Single-parent families in America — The Washington Post
- Pregnancy through health metric shifts — Maggie Appleton
Data Visualization Weekly: January 24, 2025 — January 31, 2025
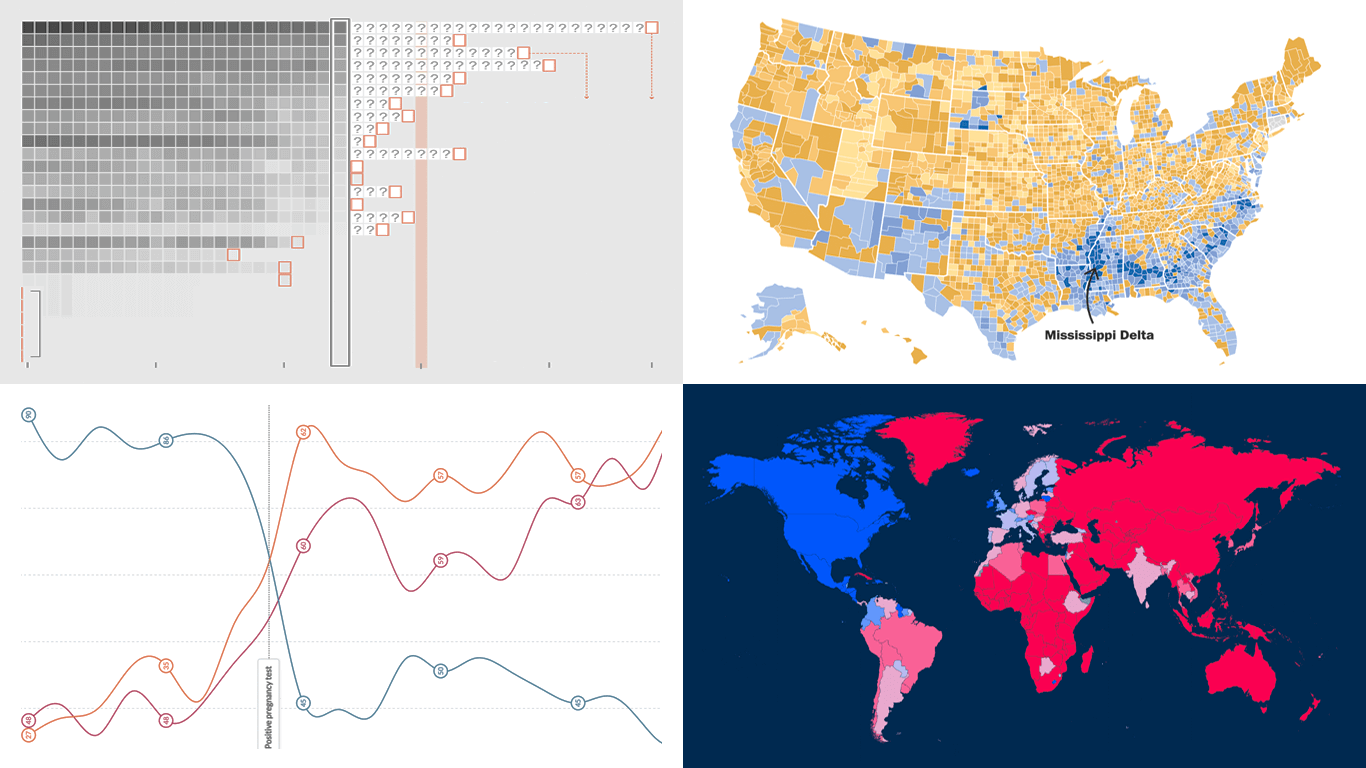
European Electricity Transition
The European Union’s energy landscape continues to evolve as the shift to renewables progresses. In 2024, the transition of the EU electricity sector maintained momentum, with solar surpassing coal power for the first time.
Ember’s ninth annual European Electricity Review provides a detailed analysis of power sector trends across all 27 EU countries, using full-year data from 2024. Led by Chris Rosslowe and Beatrice Petrovich, the report presents a range of visualizations illustrating changes in electricity generation and demand. It highlights the continued rise of wind and solar alongside the decline of fossil fuels, offering insights into the progress made toward clean energy. The underlying dataset is freely available, offering both annual and monthly levels.
Explore the report on Ember’s website.
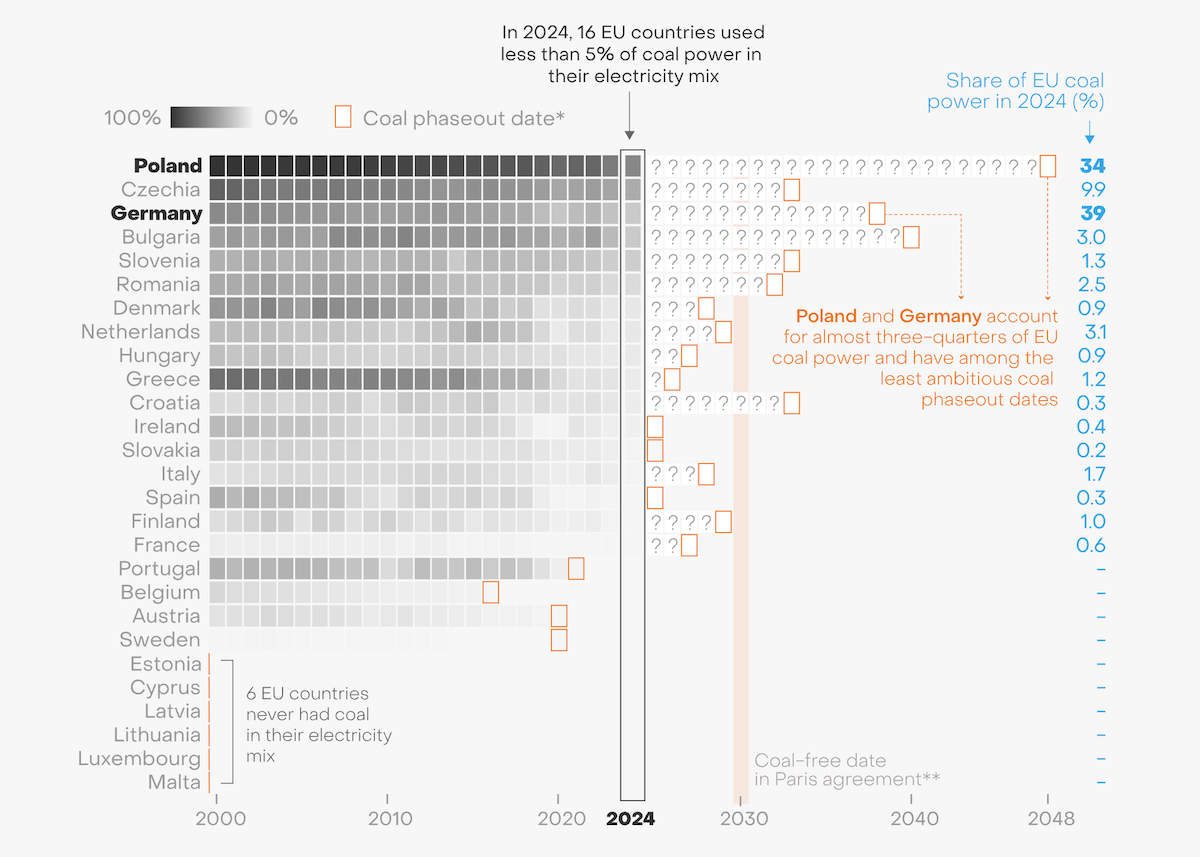
United States vs. China on Global Trade
As the world’s two largest economies, China and the United States have shaped global trade for decades. However, their roles have shifted significantly since the early 2000s. At the start of the century, most countries traded more with the U.S., but today, most trade more with China.
Roland Rajah and Ahmed Albayrak from the Lowy Institute investigated this transformation, analyzing trade patterns from 2001 to 2023. Their key visualization is an animated interactive map that illustrates how trade ties have evolved, with countries shaded in blue for the U.S. and red for China based on their top trading partner. The default view displays total trade flows, with options to display exports or imports separately.
Check out the analysis on the Lowy Institute’s website.
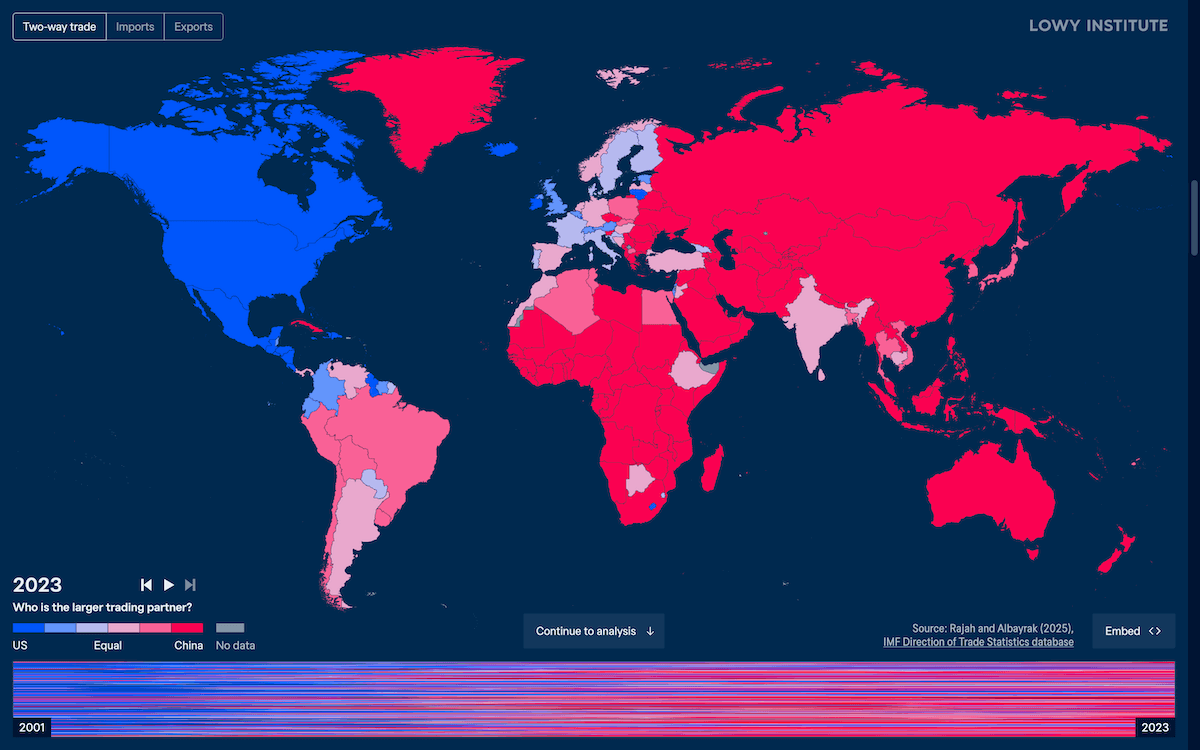
Single-Parent Families in America
In Kindergarten Cop (1990), Arnold Schwarzenegger’s character is told that Astoria, Oregon, is the “single-parent capital of America.” Decades later, how accurate is that claim?
Andrew Van Dam explores this question in The Washington Post’s Department of Data column, using data from the U.S. Census Bureau’s American Community Survey. A detailed choropleth map, the one you see above, highlights where single-parent families make up the largest share of households with children, revealing notable regional patterns. Additional visualizations provide further context, shedding light on broader societal patterns.
See the piece on The Washington Post.
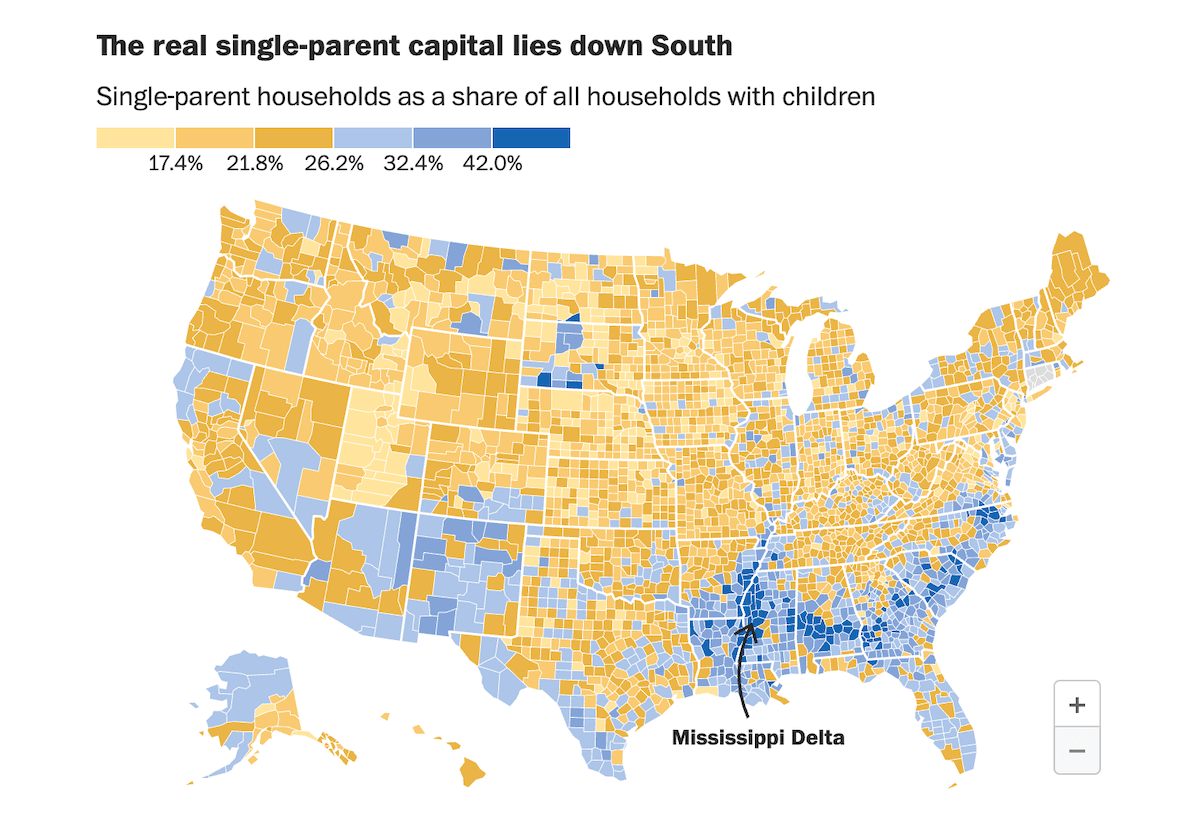
Pregnancy Through Health Metric Shifts
Pregnancy affects nearly every aspect of daily life, bringing both physical and emotional changes. While often subjective, these shifts can also be tracked through biometric data.
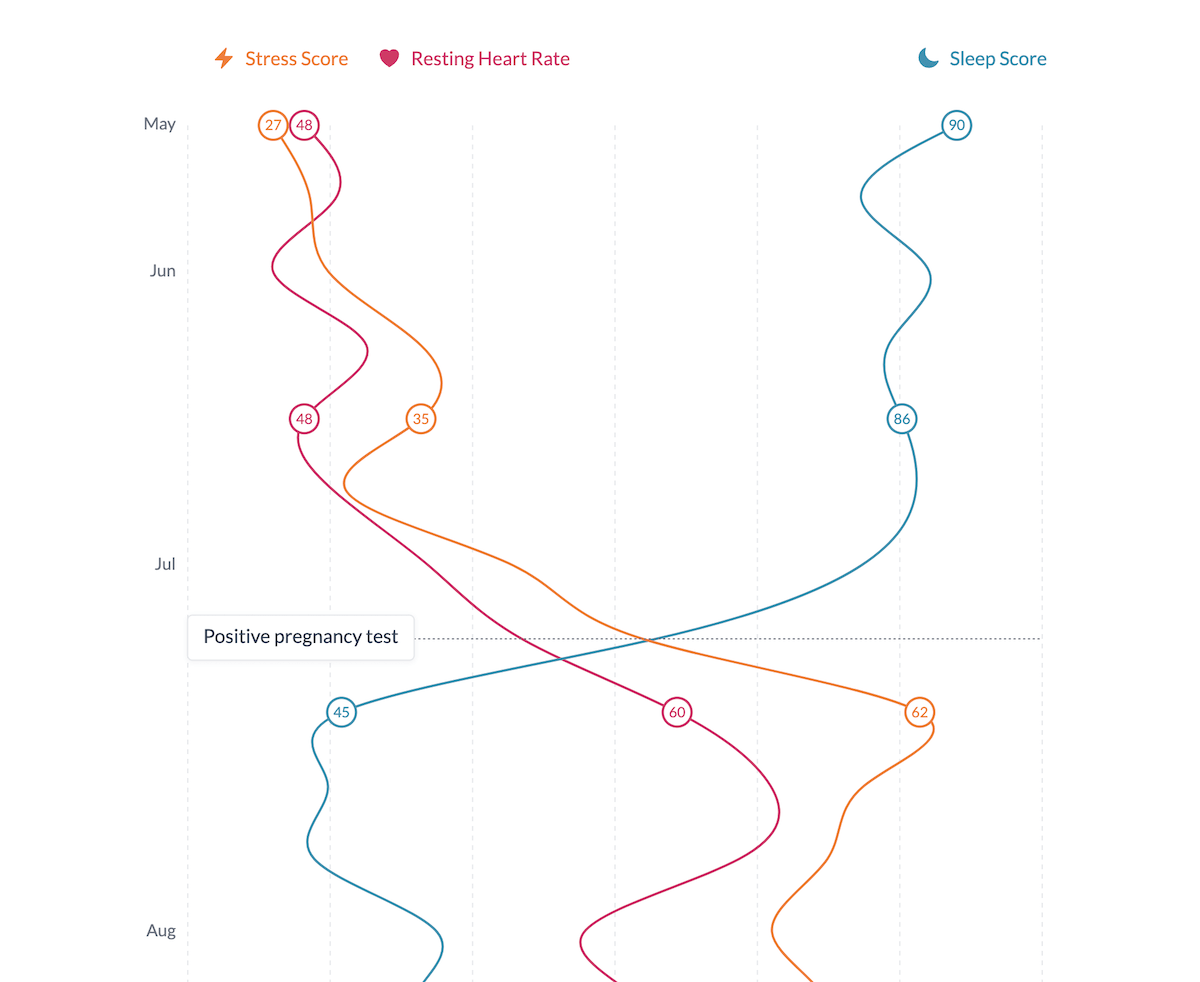
Designer Maggie Appleton documented her pregnancy journey, blending personal reflections with real health indicators. The centerpiece visualization in her story, “Growing a Human,” is an interactive vertical line chart that tracks trends in her sleep quality, resting heart rate, and stress levels over seven months, based on Garmin watch data. The graphic greatly illustrates shifts before and during pregnancy, highlighting patterns in how her body adapted. Maggie notes that seeing her exhaustion reflected in the data provided a sense of validation.
Discover the article on Maggie Appleton’s website.
Wrapping Up
From tracking shifts in trade and electricity generation to exploring family structures and personal health metrics, these new projects highlight the power of visualized data to inform, reveal patterns, and tell impactful stories.
Stay tuned for more inspiring examples in the next DataViz Weekly!
- Categories: Data Visualization Weekly
- No Comments »