 Displaying unique images as markers can add a distinctive touch to your charts, making data visualization more engaging and informative. In this edition of JS Chart Tips, we will guide you through the process of using custom image markers for each data point in a quadrant chart with our JavaScript charting library.
Question: How to Display Custom Images as Markers in Quadrants?
A user recently reached out to our Support Team with a question that, in a nutshell, boils down to the following: “Can I change the marker in a quadrant chart into a custom image?” We recognized the need to achieve something like what is shown below:
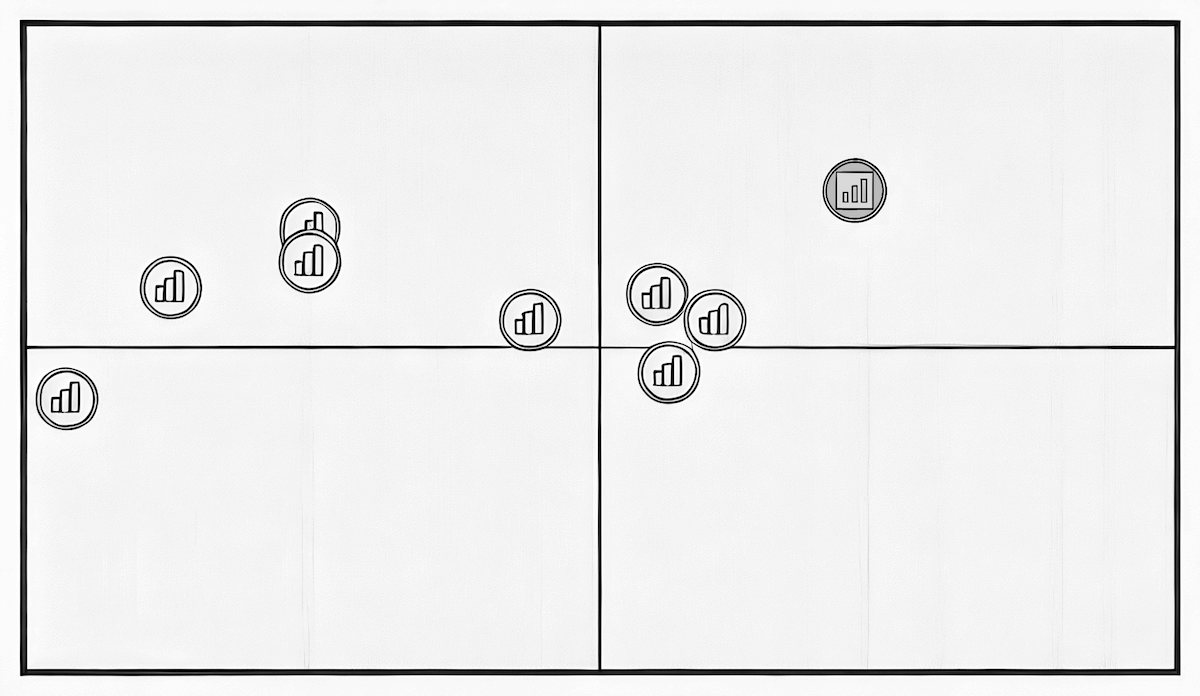
So, the short answer is yes, and now we will show you exactly how. If you have a similar requirement, follow along!
Solution: Adding Images as Markers for Quadrant Data Points
Overview
When you create a JS quadrant chart with AnyChart, data is represented as a marker series by default. To make these markers appear as custom images, use the fill() method and specify the image source URL.
To display unique images for each data point, add a custom property in your dataset containing the image URL. By passing a custom function into the fill() method, you can dynamically extract and apply the image URLs for the series markers.
In Detail
Let’s now see exactly how this solution looks in a quick example.
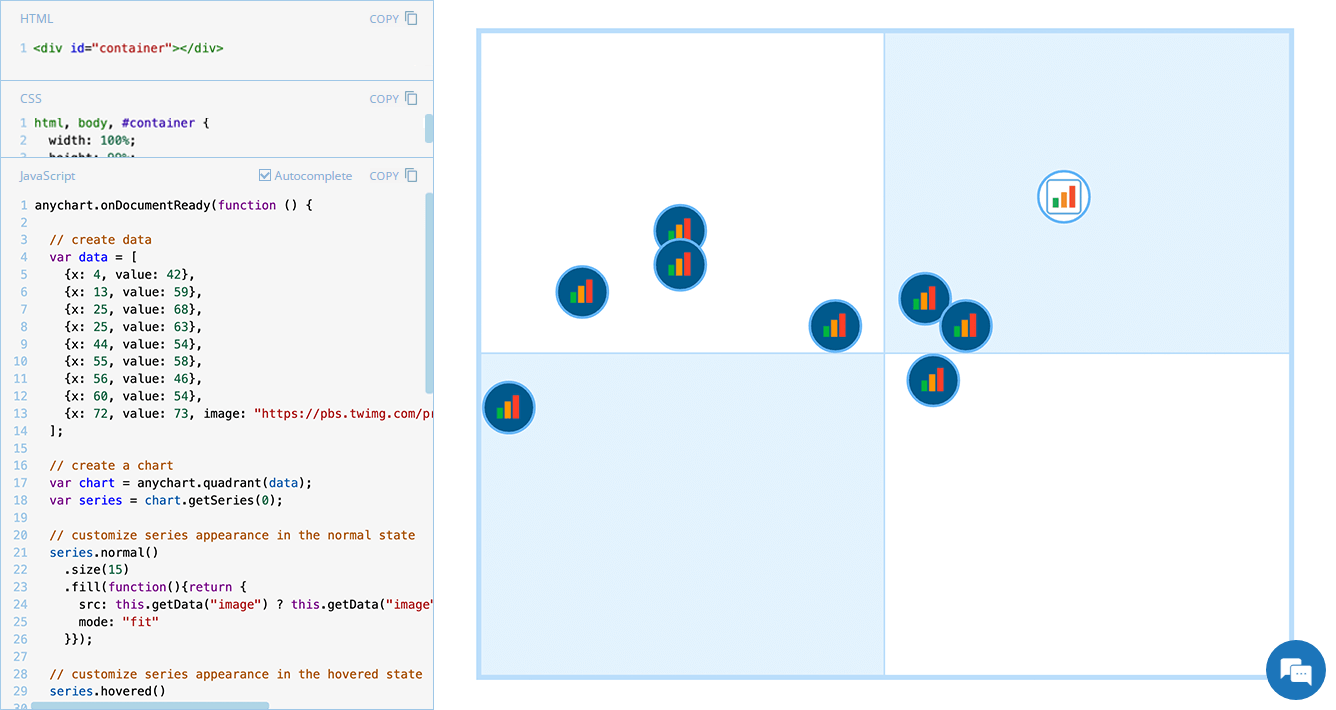
First of all, we create a basic quadrant chart. The following JavaScript code is enough to generate such a visualization, with data introduced as an array of objects:
anychart.onDocumentReady(function () {
  // create data
  var data = [
    {x: 4, value: 42},
    {x: 13, value: 59},
    {x: 25, value: 68},
    {x: 25, value: 63},
    {x: 44, value: 54},
    {x: 55, value: 58},
    {x: 56, value: 46},
    {x: 60, value: 54},
    {x: 72, value: 73}
  ];

  // create a chart
  var chart = anychart.quadrant(data);

  // set the chart title
  chart.title("Quadrant Chart with Images as Markers");

  // set the container id
  chart.container("container");

  // initiate drawing the chart
  chart.draw();
});
Second, for each data point, you can specify the URL of an image to be used as a marker by adding a custom property. In this example, here’s how we add an image to the last data point:
{x: 72, value: 73, image: "https://pbs.twimg.com/profile_images/1389594666287476744/jbdbQ5Oh_400x400.jpg"}Third, we customize the series by using the fill() method with a custom function to dynamically extract and apply the image URLs for each marker. In the example below, the function is set for the normal state of the data points. It applies the image URL from the dataset to each data point, and if the URL is absent, it applies a default image URL instead:
series.normal()
  .fill(function(){
    return {
      src: this.getData("image") ? this.getData("image") : "https://www.anychart.com/_design/img/static/AnyChart-circle.png"
    };
  });
Fourth, we can customize the marker appearance to ensure the images display as intended. For example, let’s adjust the size and fill mode, as well as configure how markers look not only in the normal state but also in hovered and selected states:
// customize series appearance in the normal state
series.normal()
.size(15)
.fill(function(){
return {
src: this.getData("image") ? this.getData("image") : "https://www.anychart.com/_design/img/static/AnyChart-circle.png",
mode: "fit"
};
});
// customize series appearance in the hovered state
series.hovered()
.size(20)
.fill(function(){
return {
src: this.getData("image") ? this.getData("image") : "https://www.anychart.com/_design/img/static/AnyChart-circle.png",
mode: "fit"
};
});
// customize series appearance in the selected state
series.selected()
.size(25)
.fill(function(){
return {
src: this.getData("image") ? this.getData("image") : "https://www.anychart.com/_design/img/static/AnyChart-circle.png",
mode: "fit"
};
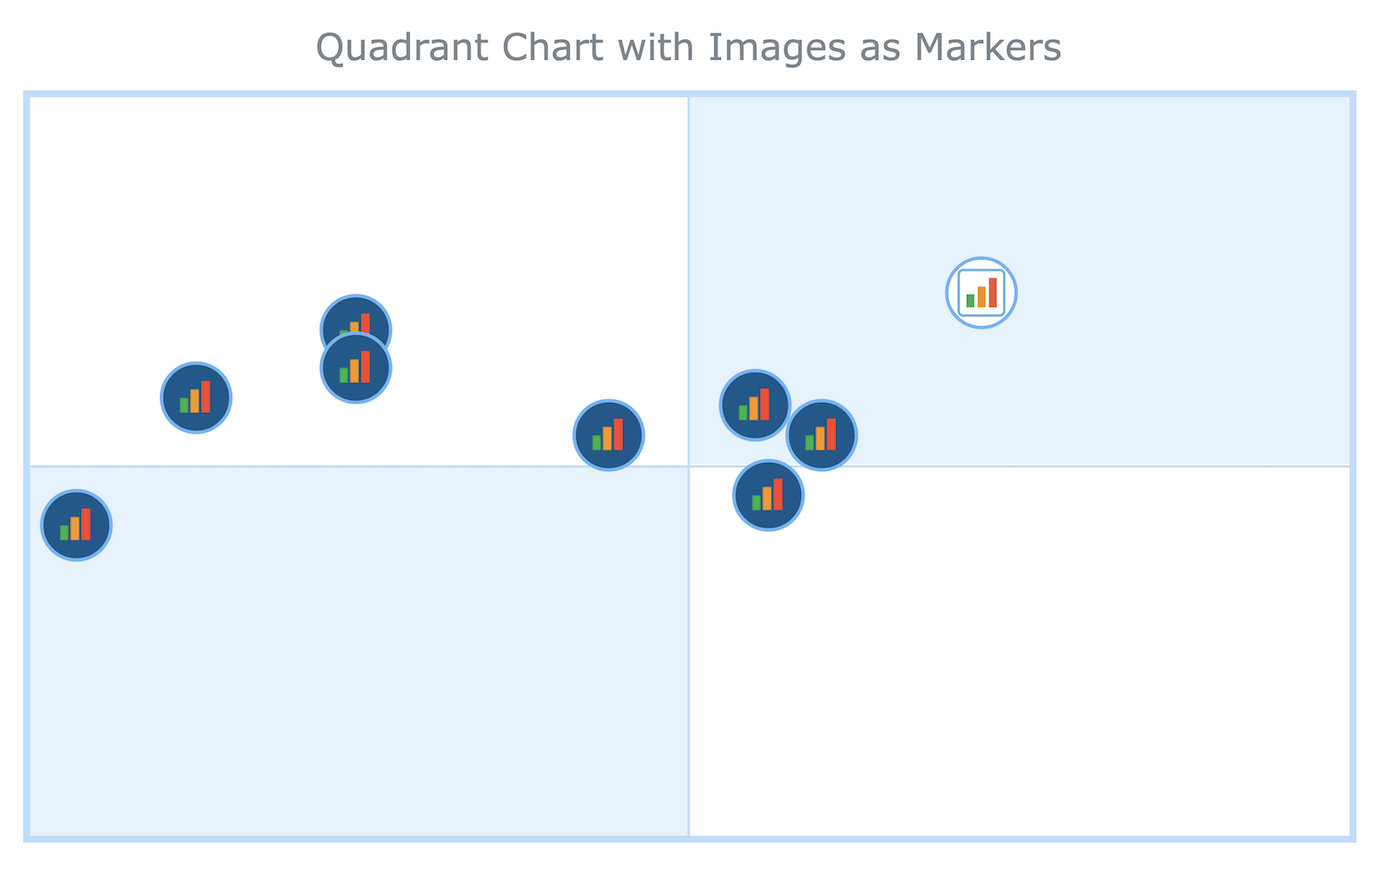
});That’s it! Our quadrant chart now uses images as markers.
If you have a similar case, you might prefer a more concise version to achieve the same result:
// define fill logic
function customFill(point) {
  return {
    src: this.getData("image") || "https://www.anychart.com/_design/img/static/AnyChart-circle.png",
    mode: "fit"
  };
};

// apply fill logic to different states
series.normal().size(15).fill(customFill);
series.hovered().size(20).fill(customFill);
series.selected().size(25).fill(customFill);
Examples
Check out an example of a JavaScript quadrant chart with images as markers, and feel free to experiment further with its code and visualization:
Further Learning
To learn more, refer to our JavaScript charting documentation:
- Quadrant Chart — Basic Charts | AnyChart JS Documentation
- Fill Settings — Graphics | AnyChart JS Documentation
And the API reference:
- AnyChart Core Scatter Series Marker Fill | AnyChart JS API Reference
- Graphics Vector Image Fill Mode | AnyChart JS API Reference
Wrapping Up
Whenever you need custom image markers for your quadrant charts, now you know how to implement them. For more tips and tricks, keep following our JavaScript Chart Tips series. And feel free to contact our Support Team whenever you have any questions regarding any of the chart types or features of our JavaScript charting library. Have a great data visualization time!
- Categories: AnyChart Charting Component, HTML5, JavaScript, JS Chart Tips, Tips and Tricks
- No Comments »