Today we present you a beta version of AnyGantt – now JavaScript (HTML5). Note that the new AnyGantt is much better integrated with AnyChart (and vice versa): all charts or their components can be combined and used together.

Though it is just a beta, all key features are already available:
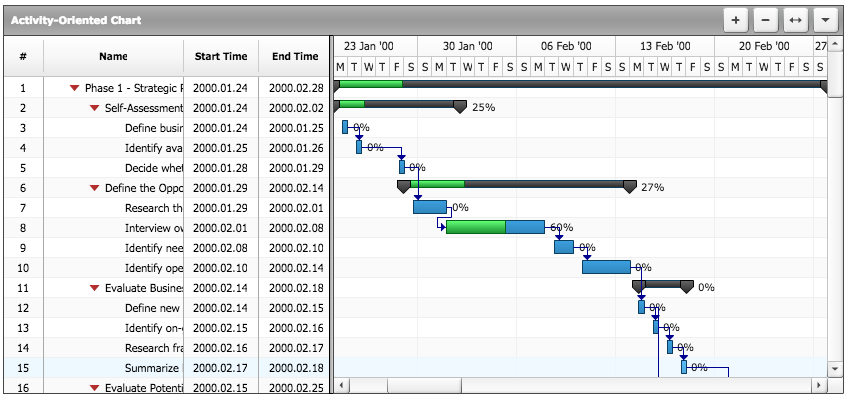 |
Project Gantt Chart Intended for showing progress of completion of a single task or a group of tasks, taking into consideration their planned time periods and actual ones. Read more about the Project Gantt Chart >> Take a look at a Gallery sample >> |
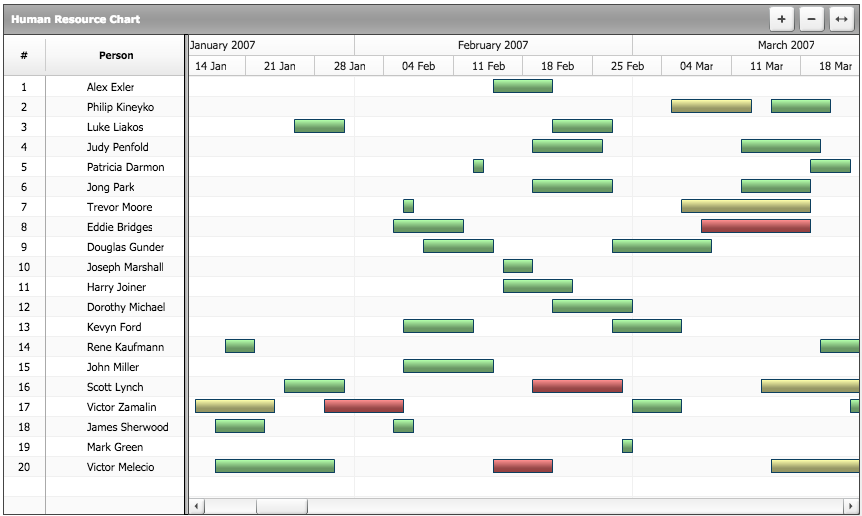 |
Resource Gantt Chart Intended for showing the resources you have and spreading these resources along the timeline (into periods). Read more about the Resource Gantt Chart >> Take a look at Gallery sample >> |
 |
Rich JavaScript API All AnyGantt settings can be changed dynamically at any moment. See JavaScript API >> |
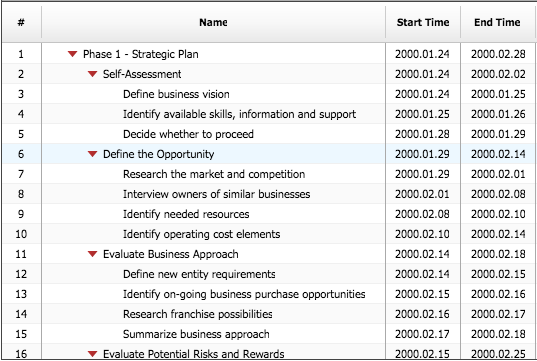 |
Data Grid as a Standalone Feature In AnyChart 7.x versions, all visual elements can be used as standalone features, and Data Grid is not an exception. Take a look at a Gallery sample >> |
AnyGantt version history: http://6.anychart.com/products/anygantt7/history/
Trial download: https://www.anychart.com/download/
- Categories: AnyGantt
- No Comments »