 Welcome to DataViz Weekly, where we present a curated selection of stunning data visualization examples our there. Whether you’re a data professional or simply interested in visual data, these charts and maps can provide both inspiration and practical ideas. Here’s what we have for you to explore today:
- U.S. immigration patterns — WaPo
- 2024 U.S. presidential election forecast — Silver Bulletin
- Paris Olympics 100 years later — SCMP
- Extreme heat challenges at the 2024 Summer Olympics — Bloomberg Green
Data Visualization Weekly: July 19, 2024 — July 26, 2024
U.S. Immigration Patterns
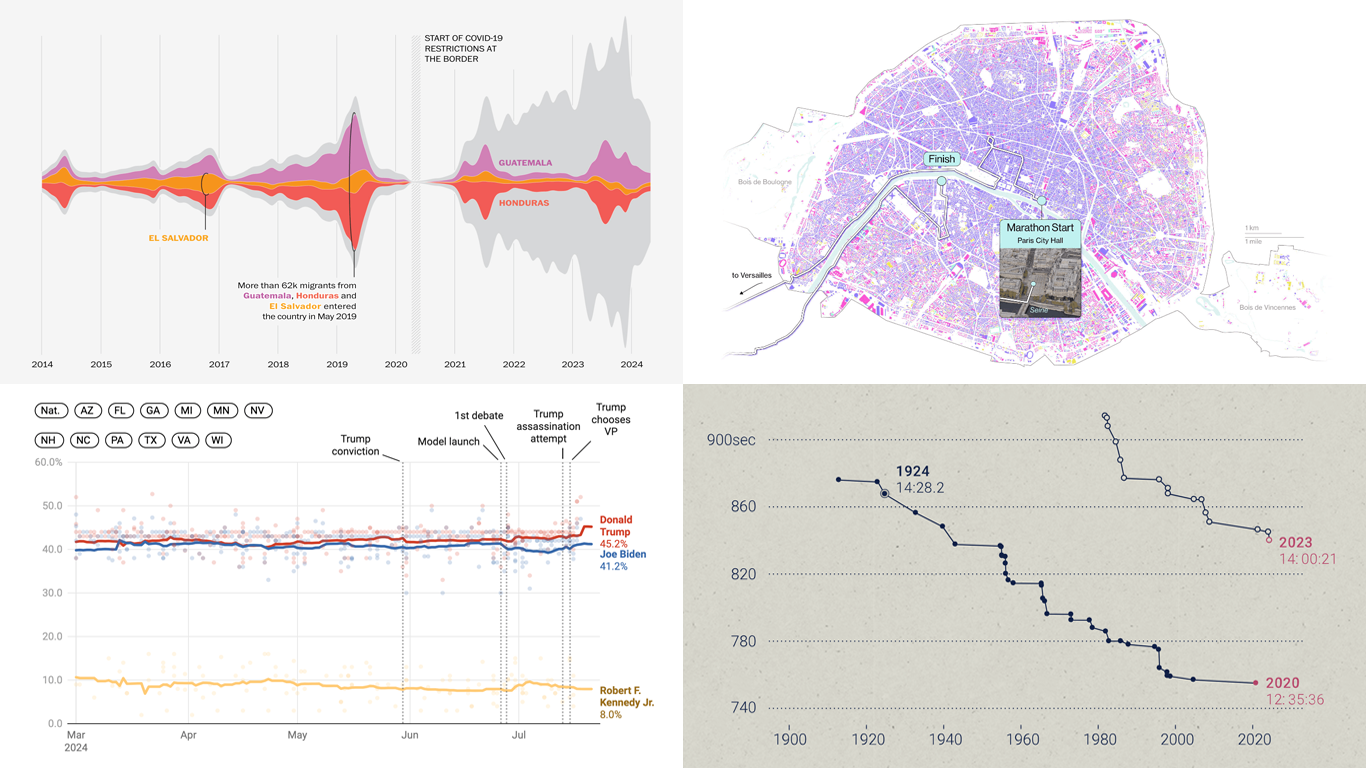
The heated discussion on immigration in the United States often centers on illegal entries at the southern border. But what happens to these and other migrants who then stay in the country while their legal status is being decided in the American immigration court system?
The Washington Post examined more than 4.1 million U.S. immigration court records spanning a decade, revealing details about migrants’ countries of origin and where they settle in the U.S. While the data doesn’t explicitly specify the method of entry for each migrant, an analysis of charges and reports shows that the majority crossed via the Mexico–U.S. border.
The report starts with a streamgraph displaying monthly influx of migrants into the immigration court system since 2014, then breaks down their origins as you scroll. Additionally, it features maps showing their settlement locations.
Explore the story on The Washington Post, by Adrián Blanco, Steven Rich, Nick Miroff, and Maria Sacchetti.
2024 U.S. Presidential Election Forecast
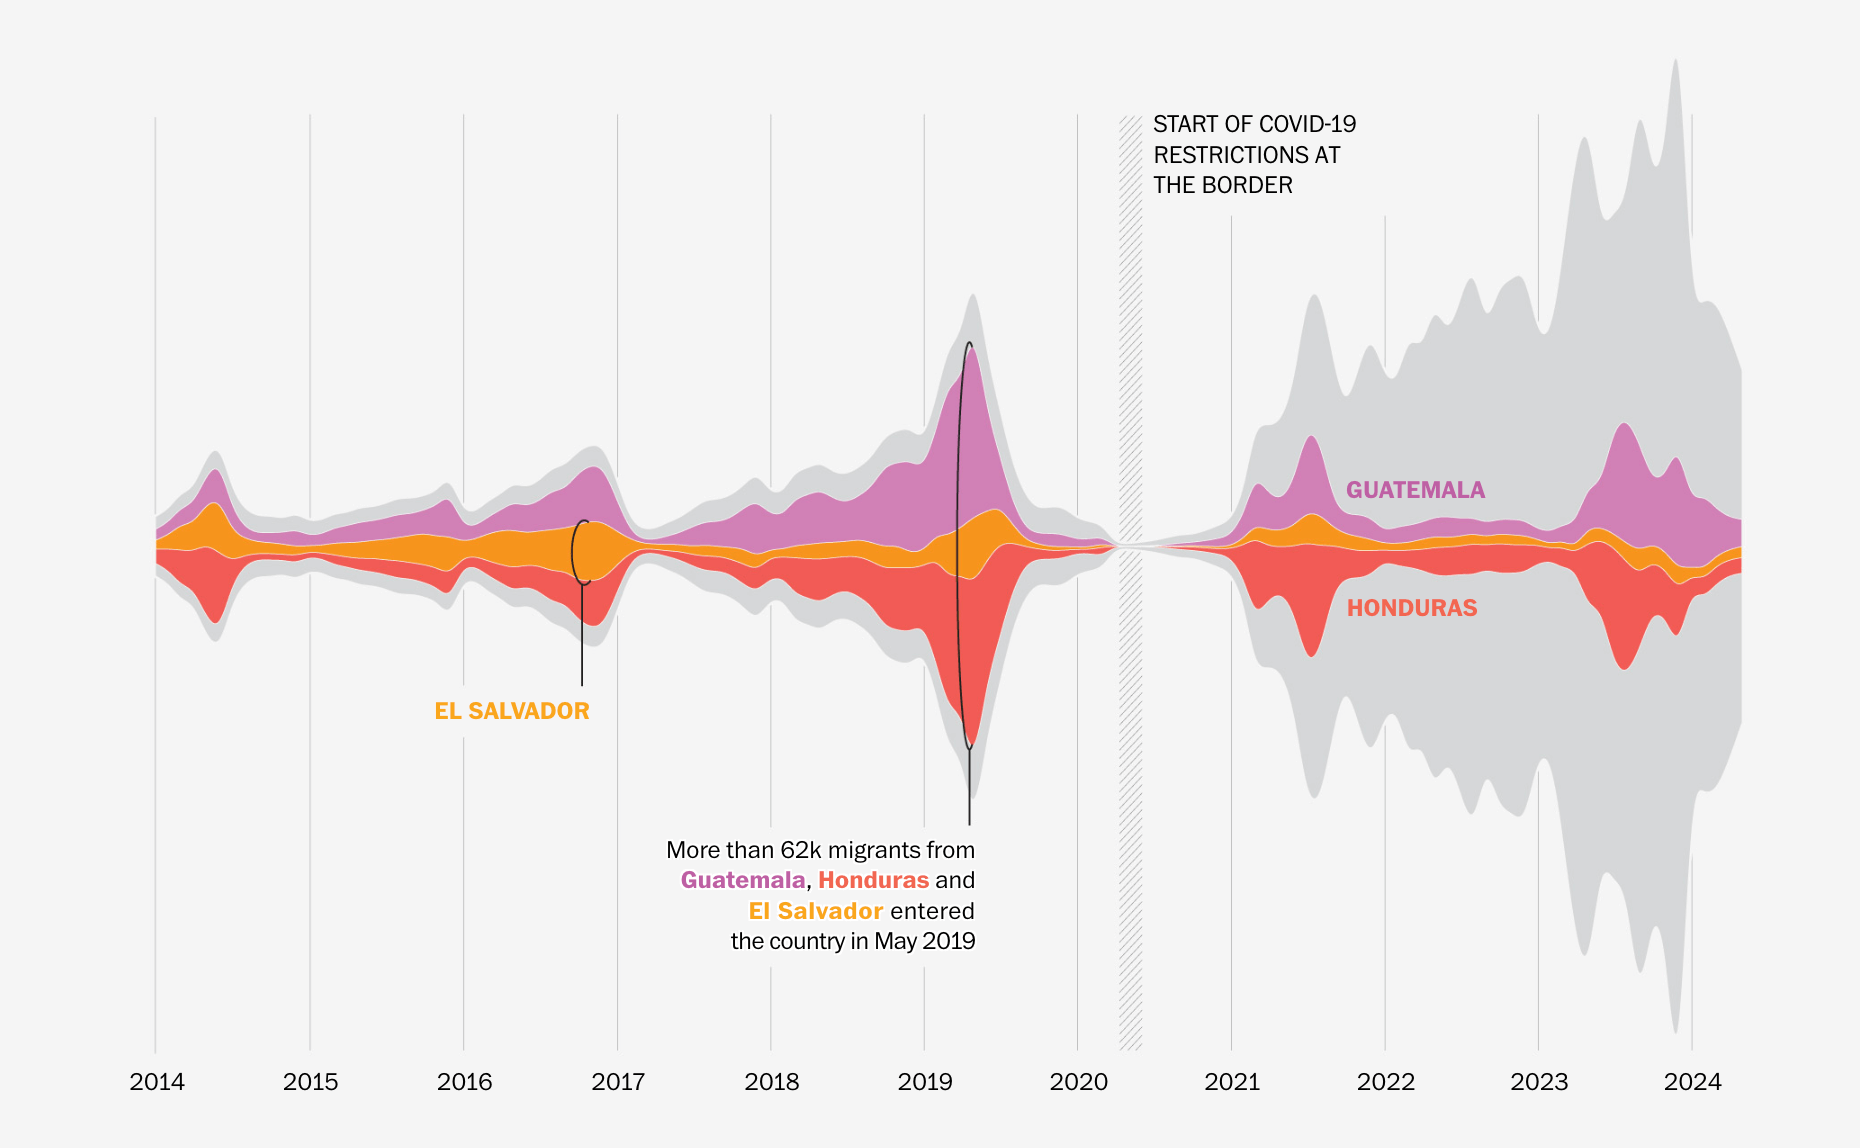
President Joe Biden revealed on Sunday that he will not pursue a second term, throwing his support behind Vice President Kamala Harris as his chosen successor. This decision has altered the political scene, causing previous Biden vs. Trump forecasts to be discontinued.
One example is Nate Silver’s election forecasting model, which directly evolved from the former model of FiveThirtyEight he had founded. After parting ways with FiveThirtyEight during the layoffs at Disney/ABC News last year, he retained the intellectual property of 538’s model and, in June 2024, introduced his forecast for the upcoming American presidential election.
Nate Silver’s model is said to be back once adequate polling data on Kamala Harris and other potential Democratic candidates is collected. For now, the final version of his Biden vs. Trump forecast is available for review.
Check it out on Silver Bulletin.
Paris Olympics 100 Years Later
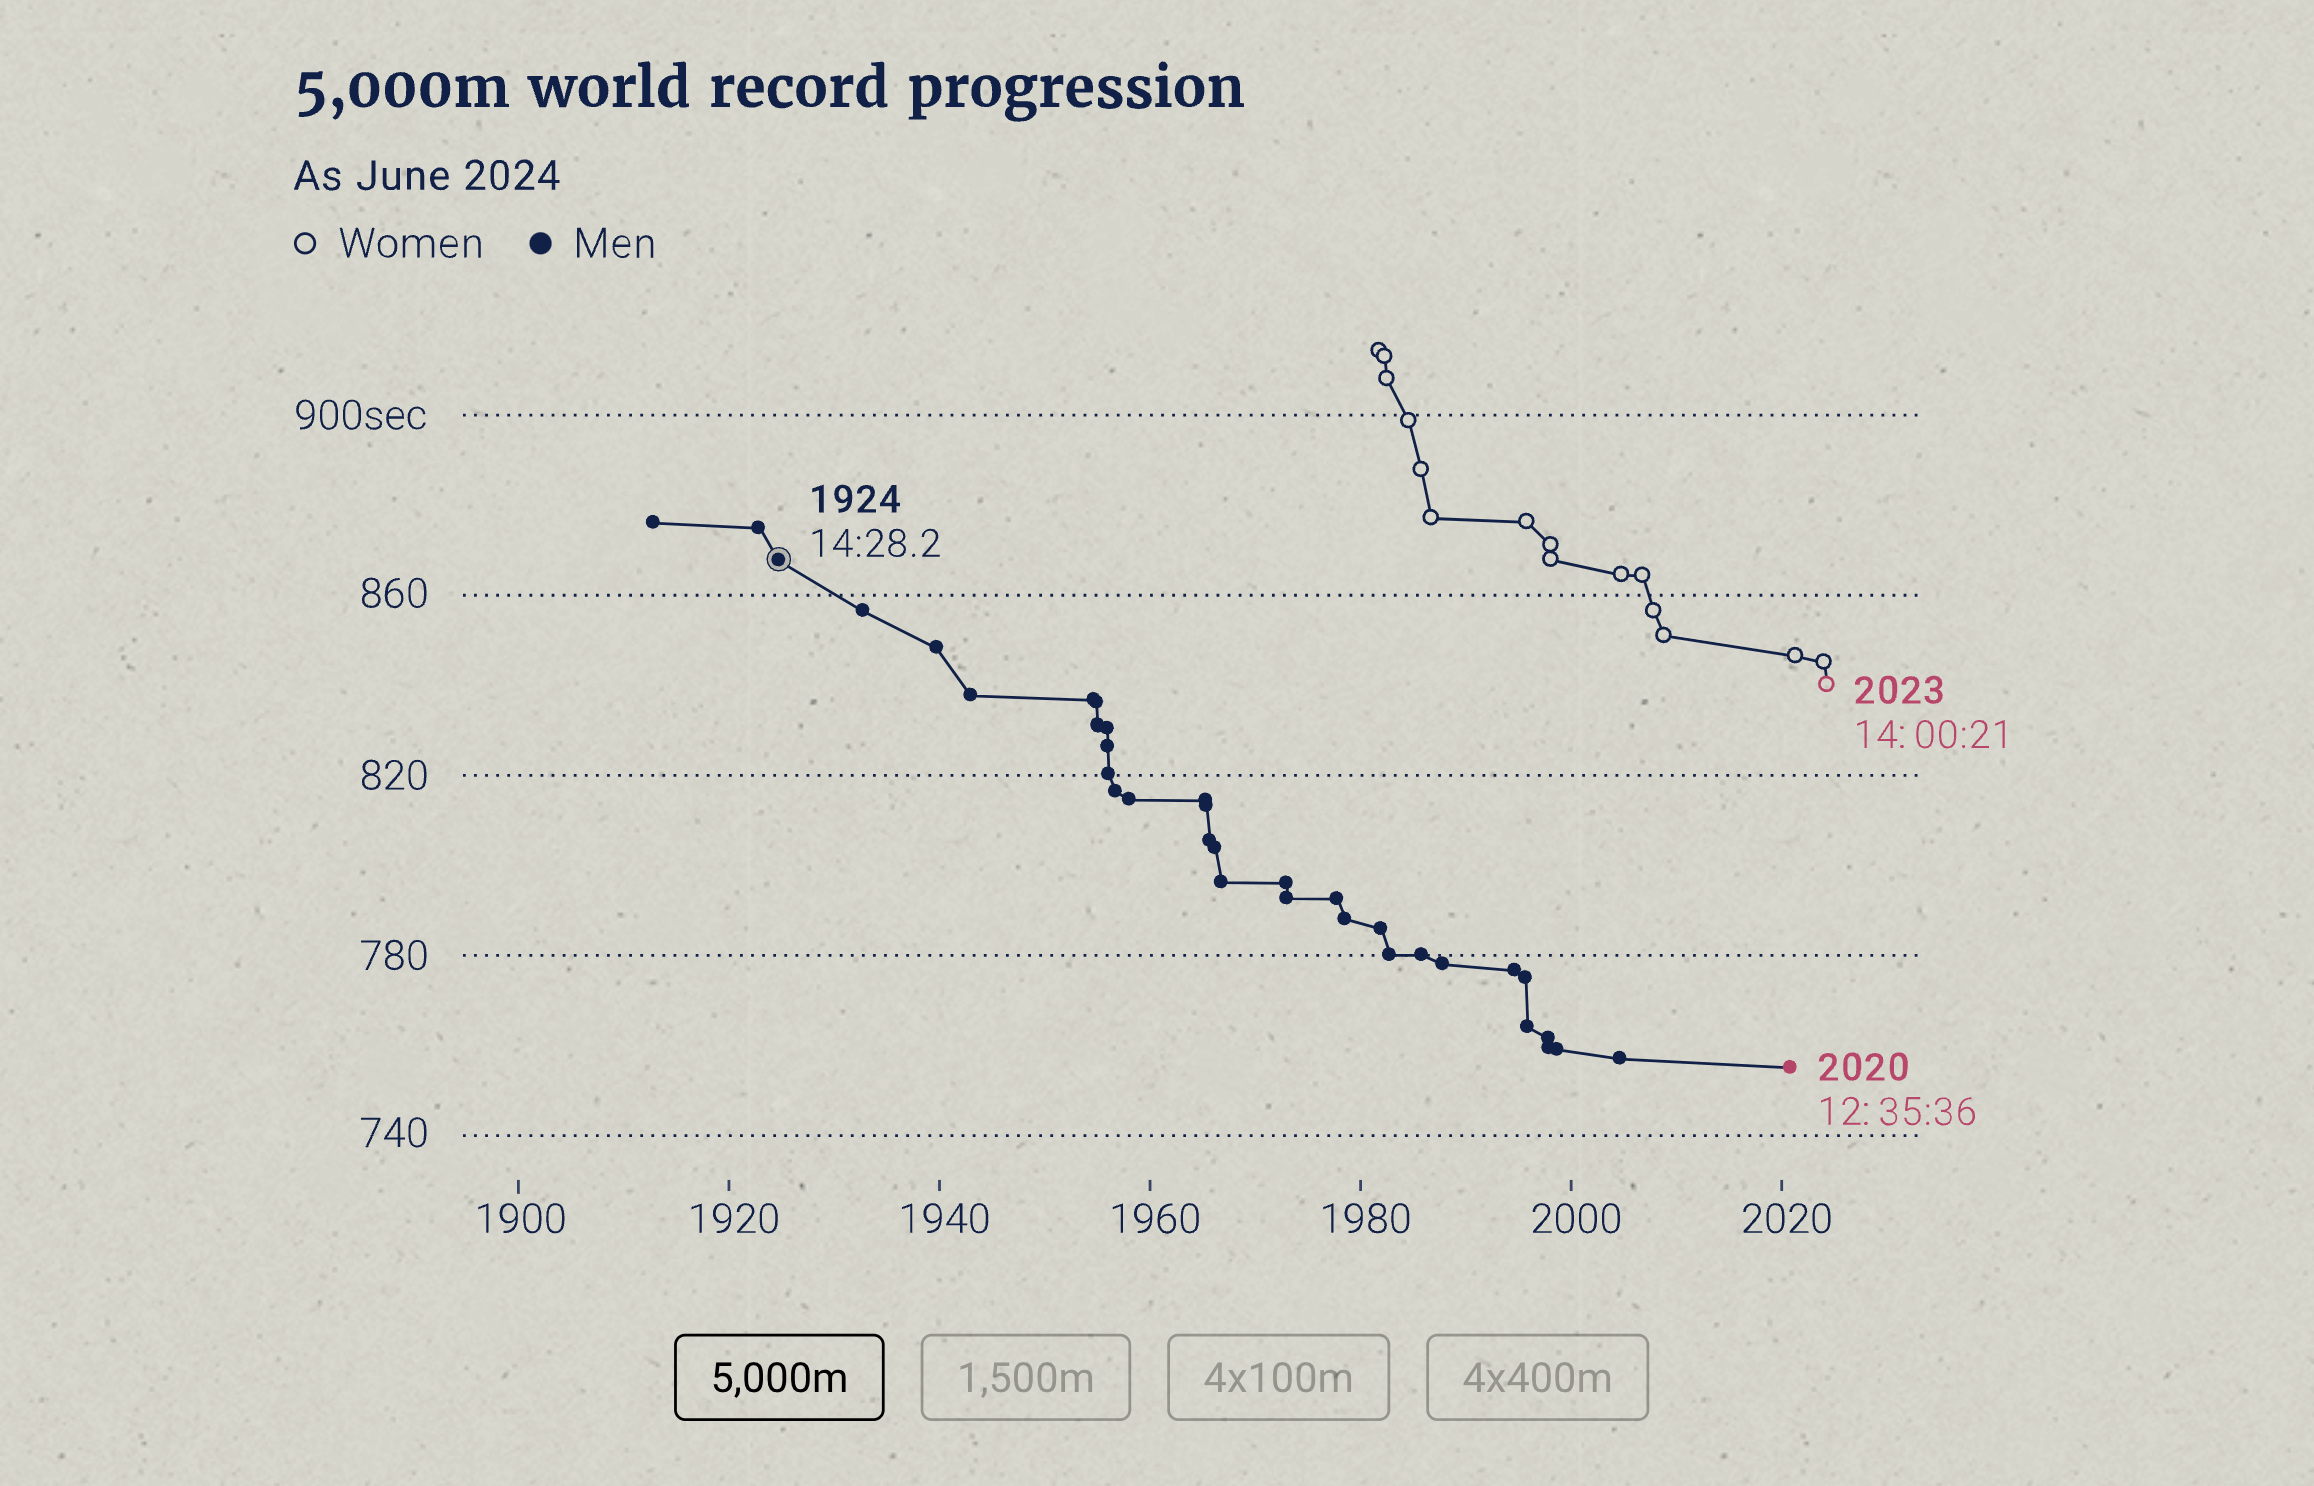
Today, Friday the 26th, the 2024 Summer Olympics kick off in Paris for the third time, marking 100 years since the French capital last hosted the Games in 1924. As you might imagine, a lot has changed in the world of sports over the past century.
The South China Morning Post offers engaging visuals that highlight the most significant changes in sports disciplines and the athletes participating in the Games over the last hundred years. Their infographics directly compare various elements and competitions from the 1924 and 2024 Olympics. Additionally, there are intriguing graphs that showcase the progression of records over time, among other insights.
Explore the visual explainer on the SCMP, by Marcelo Duhalde, Rocio Marquez, Kaliz Lee, Davies Christian Surya, Eunice Tse, Joe Lo, and Kakuen Lau.
Extreme Heat Challenges at 2024 Summer Olympics
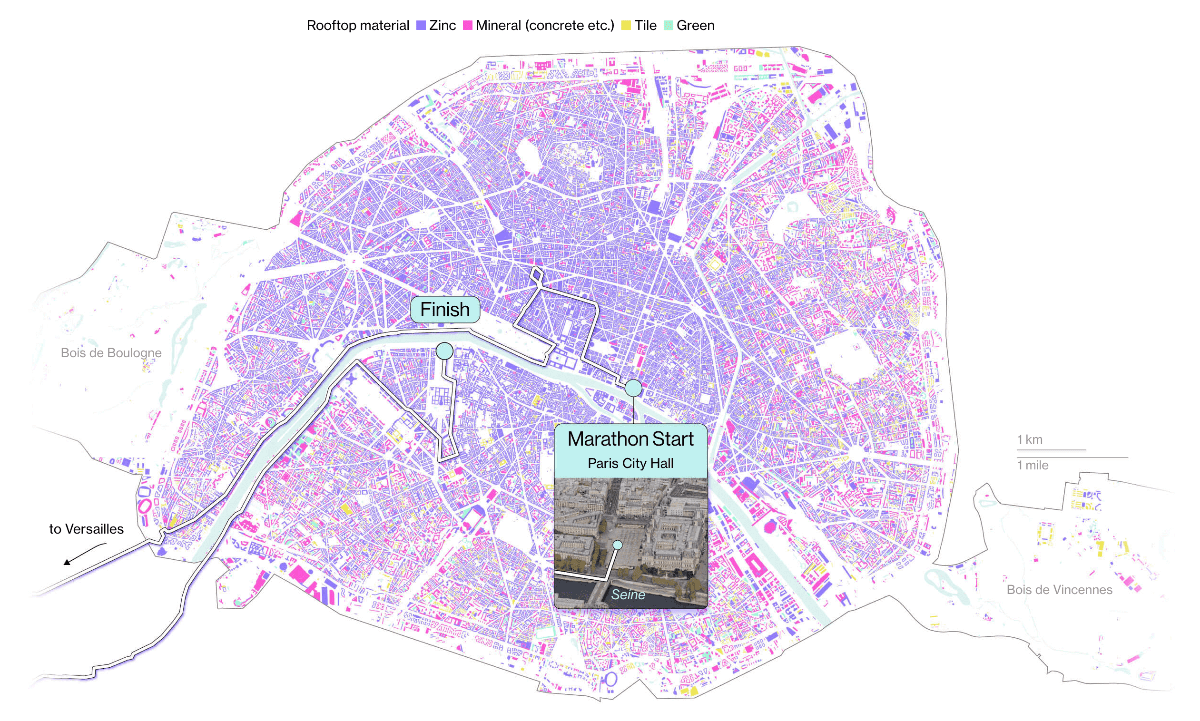
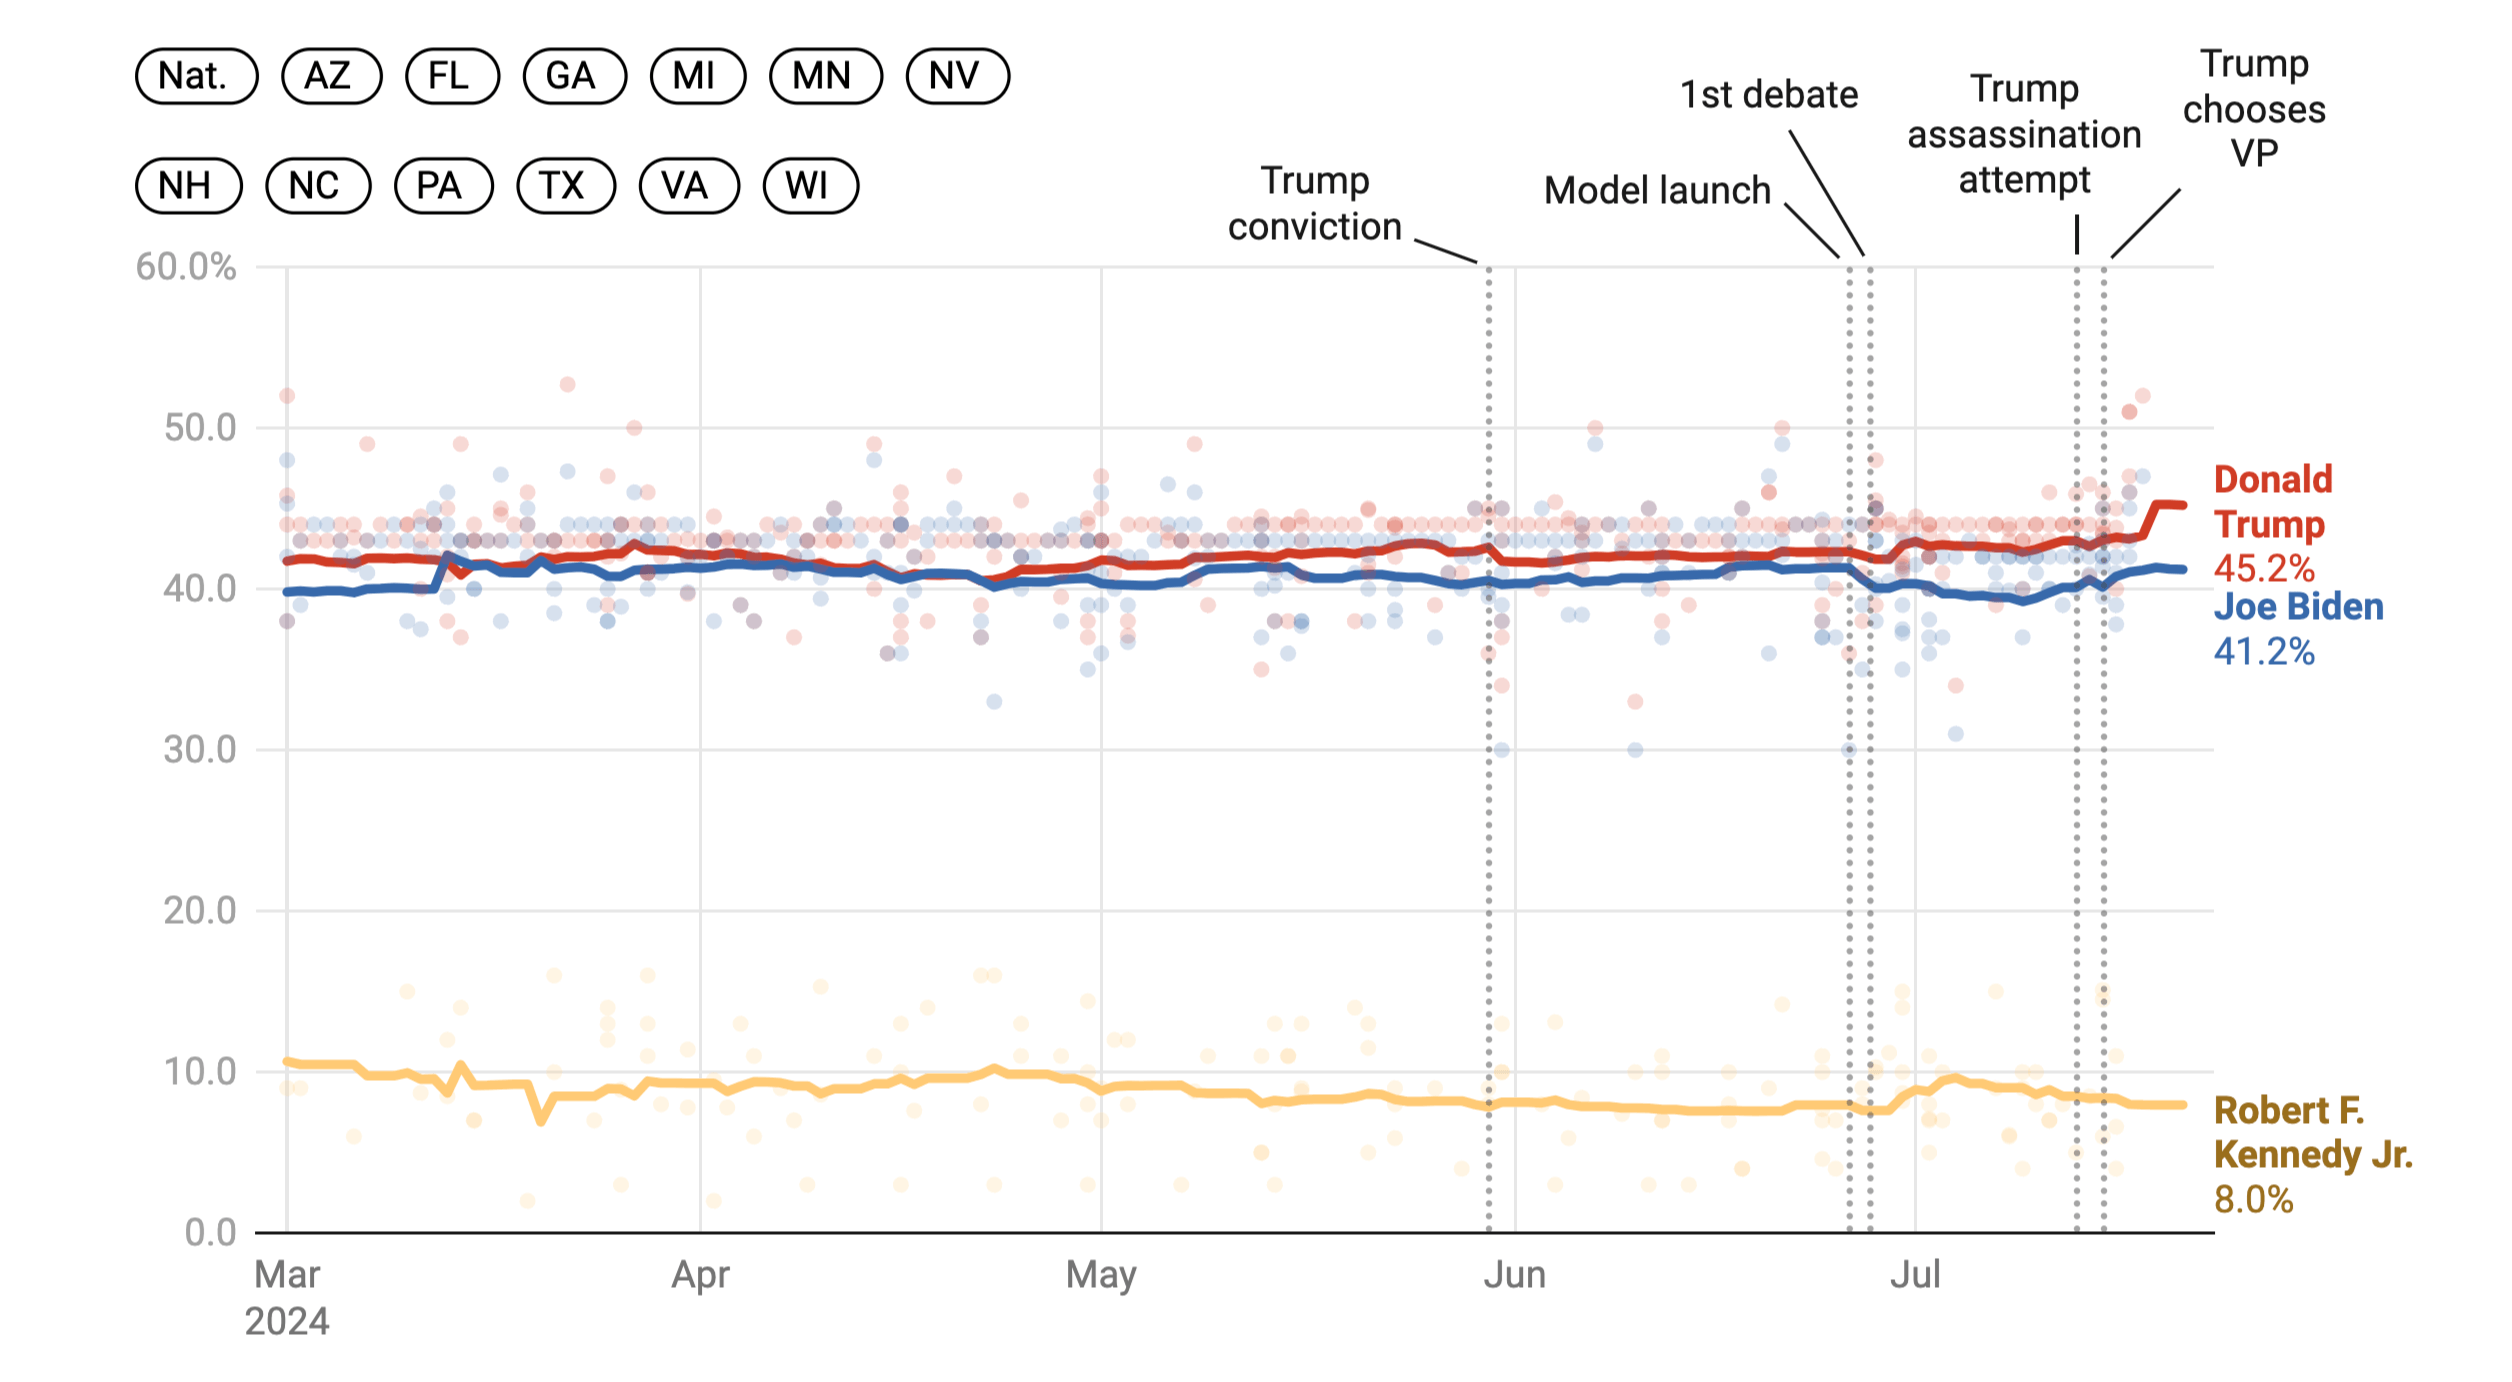
Paris, once mild, is facing significant heat challenges. A recent BASIS report states an uptick in extremely hot days and a dramatic escalation of 2,100% in the occurrence of nights resembling tropical conditions. The French capital’s quaint stone facades, metallic zinc rooftops, and slender lanes not only enhance its aesthetic appeal but also amplify the urban heat.
Bloomberg Green delves into the substantial heat challenges facing the 2024 Paris Olympics and provides a series of data-driven insights. The feature begins with visual maps pinpointing the types of materials used for rooftops across the city, with a focus on the marathon route. Notably, for example, zinc, which constitutes nearly 80% of the city’s roofing, can surge to temperatures as high as 194°F (90°C) during peak sunshine, considerably raising the heat in adjacent areas.
Further exploration zooms into the marathon route in relation to levels of risk from urban heat islands, presented in a dynamic, scrolling narrative. Keep scrolling to discover further compelling graphics.
Take a look at the article on Bloomberg Green, by Ira Boudway, Kendra Pierre-Louis, Hayley Warren, and Jin Wu Green.
Wrapping Up
Thank you for joining us in this edition of Data Visualization Weekly. We hope these curated examples have provided you with valuable insights and sparked your creativity in data visualization. Stay tuned for more remarkable visualizations and innovative techniques in our upcoming issues.
Whether you’re a seasoned data professional or a curious enthusiast, there’s always something new to discover in the world of data. Don’t miss out — keep exploring and stay inspired!
- Categories: Data Visualization Weekly
- No Comments »