 Navigating chart dimensions is key in crafting user-friendly visual presentations, especially when integrating multiple charts into an existing web page or app screen. In our JavaScript chart tutorials, charts are usually showcased as stretching across an entire web page. But it’s far from rocket science to make them smaller. In today’s JS Chart Tips, we explore three effective ways to resize your charts by adjusting their width and height.
Question: How to Set Chart Height and Width?
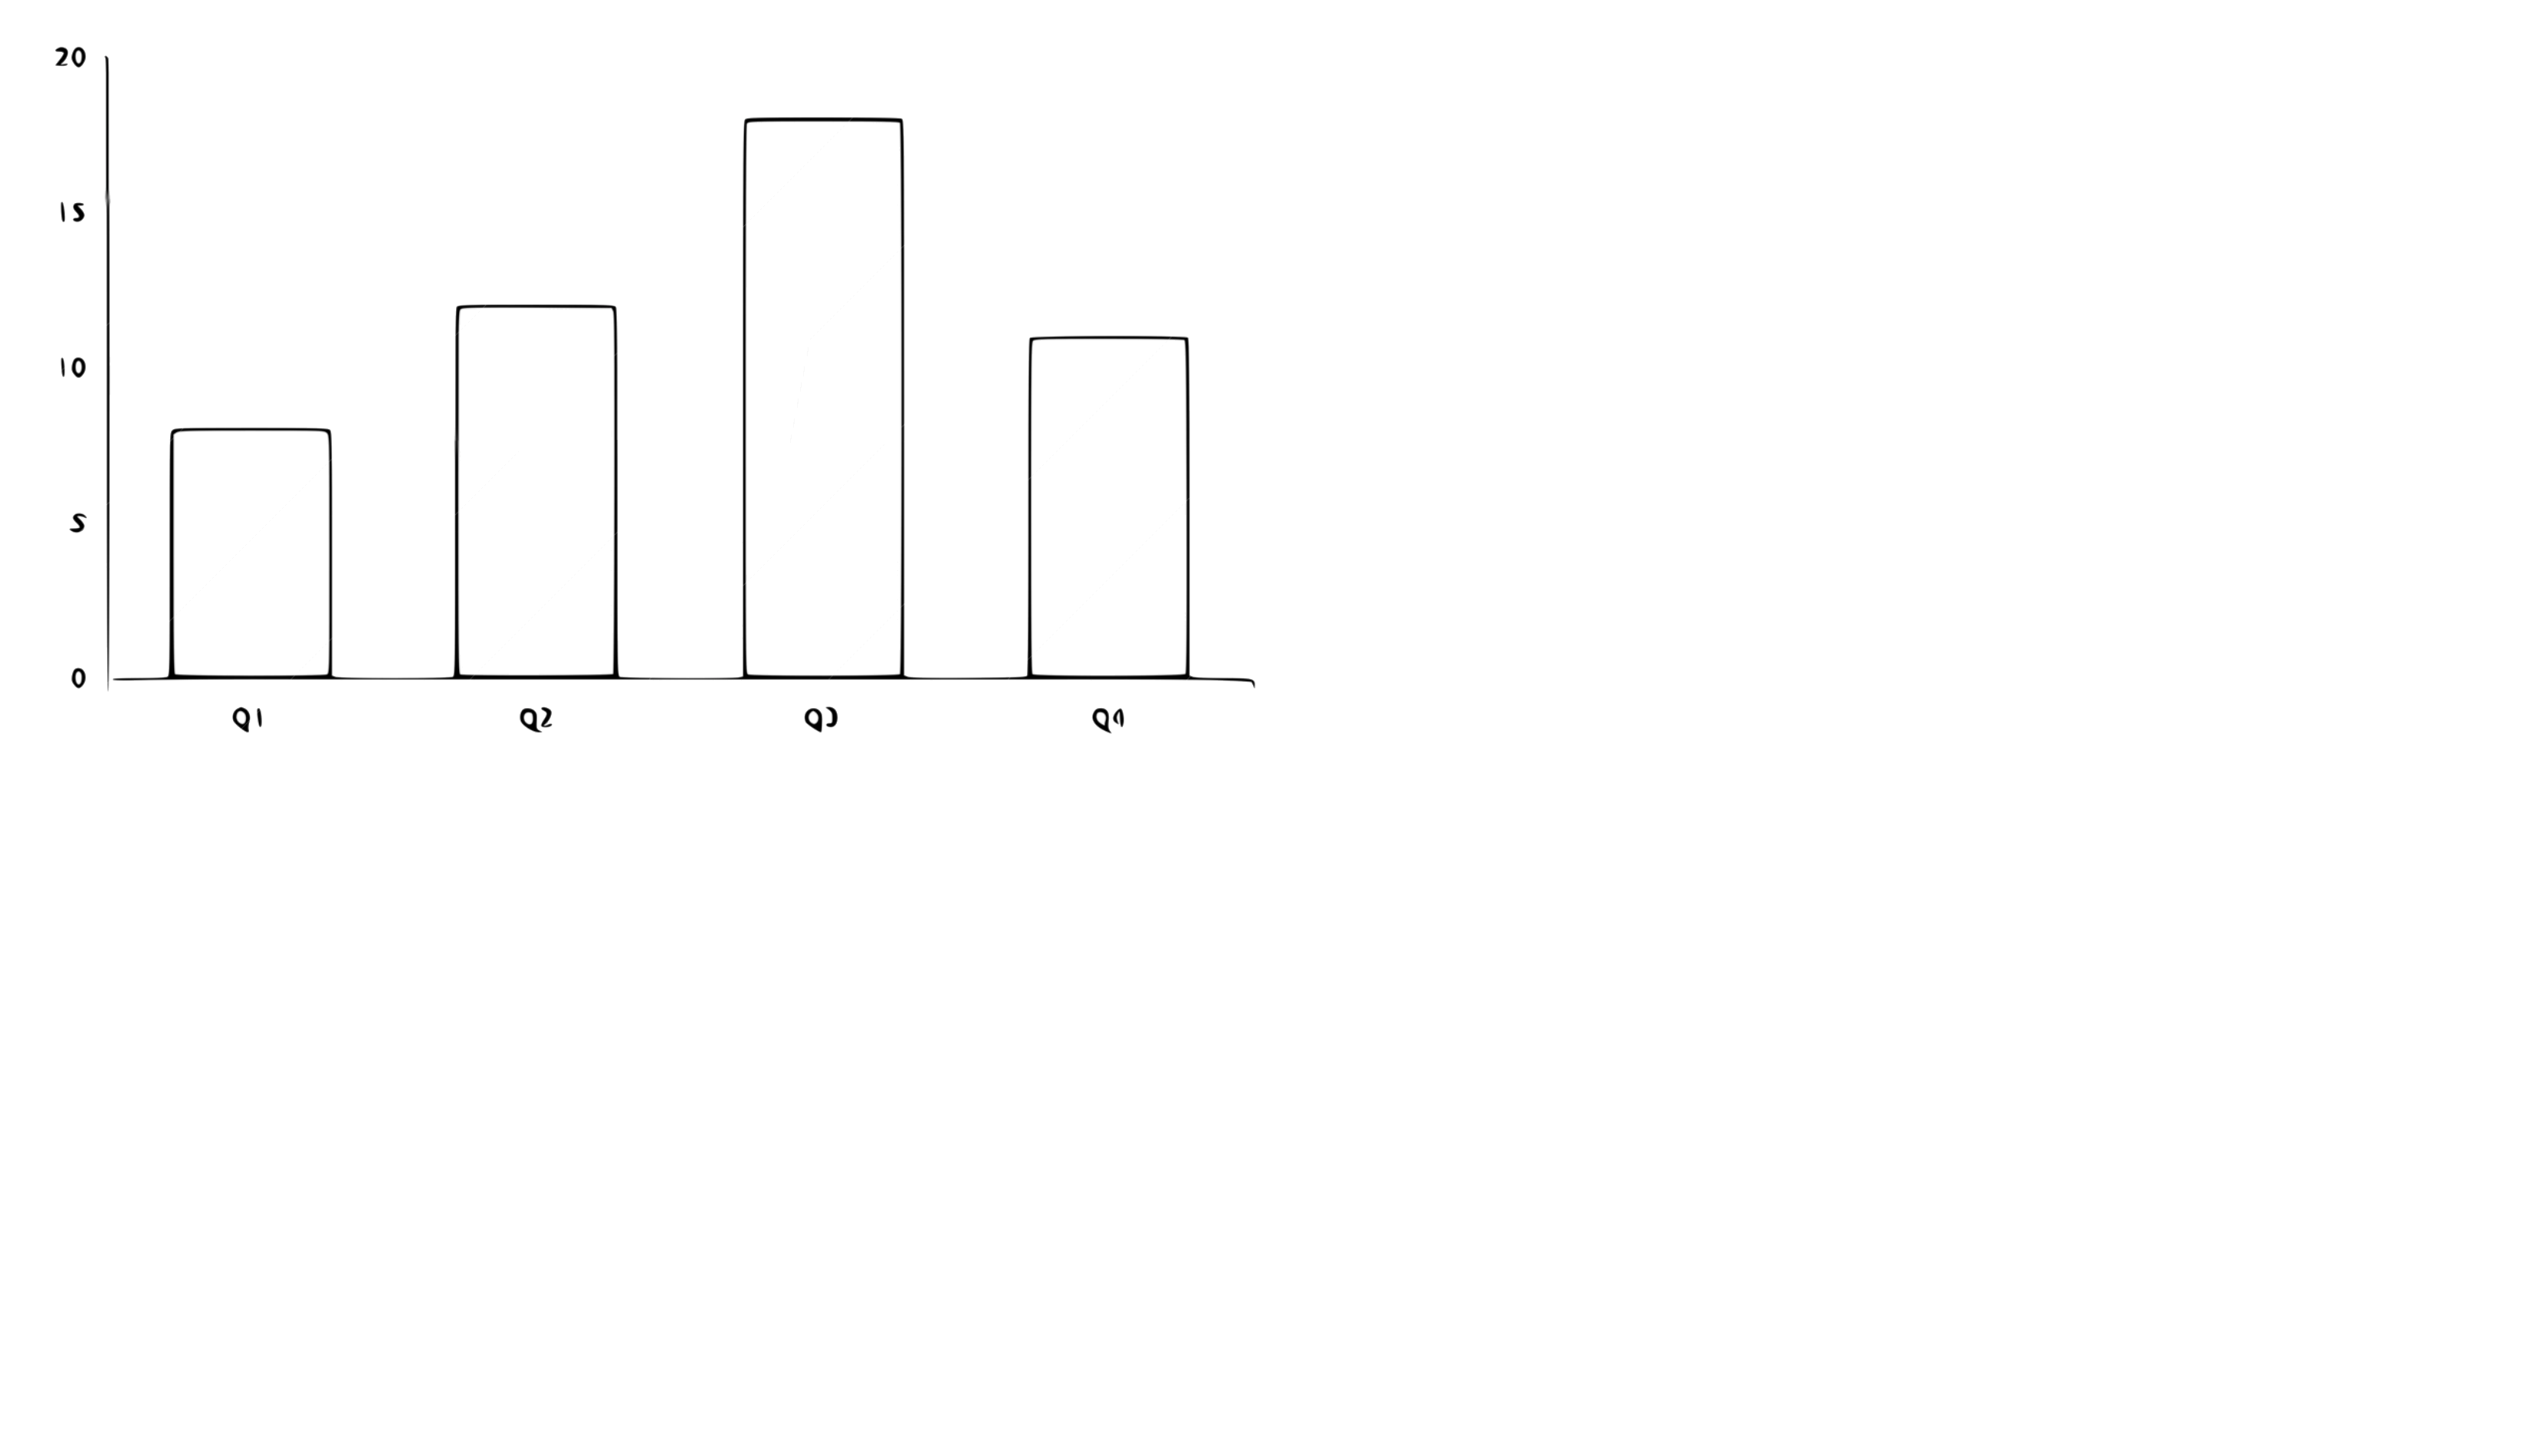
Our Support Team often gets inquiries about configuring custom chart sizes in various situations. The most recent question received via live chat was quite general: “How do I change the height of the chart?” No additional details or images were provided, so we addressed it as a general case, assuming it might look as shown below, and offered several possible solutions with relevant examples right away.
Following our response, we decided to highlight the approaches we covered, which boil down to three main options, depending on particular needs:
- Utilizing the JavaScript API
- Configuring through JSON
- Applying CSS styles
Each approach provides the necessary control and flexibility to ensure your charts fit perfectly within their designated spaces. Join us as we break down these techniques to help you optimize your charting setups.
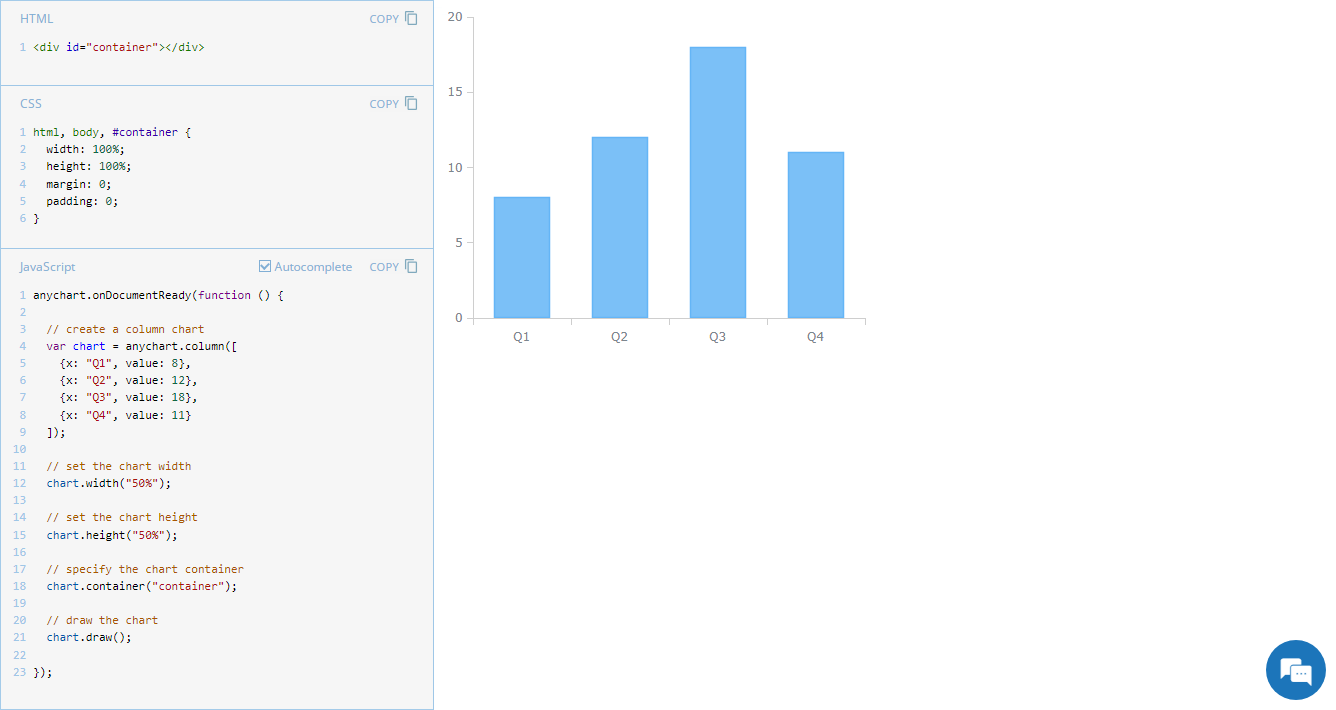
Solution 1: Configuring Height/Width in JavaScript API
Overview
You can specify the required height or width of your JavaScript chart using the height() and width() methods right inside the chart’s JS code.
In Detail
For instance, add the following line of code to set the height of your JS chart as 50% with the help of the corresponding methods from the JavaScript API:
chart.height("50%");
To configure the width, act exactly the same way with the appropriate method:
chart.width("50%");
For more information, see these methods in our API reference:
Example
Check out an example of a chart where the height and width settings are specified using the JavaScript API:

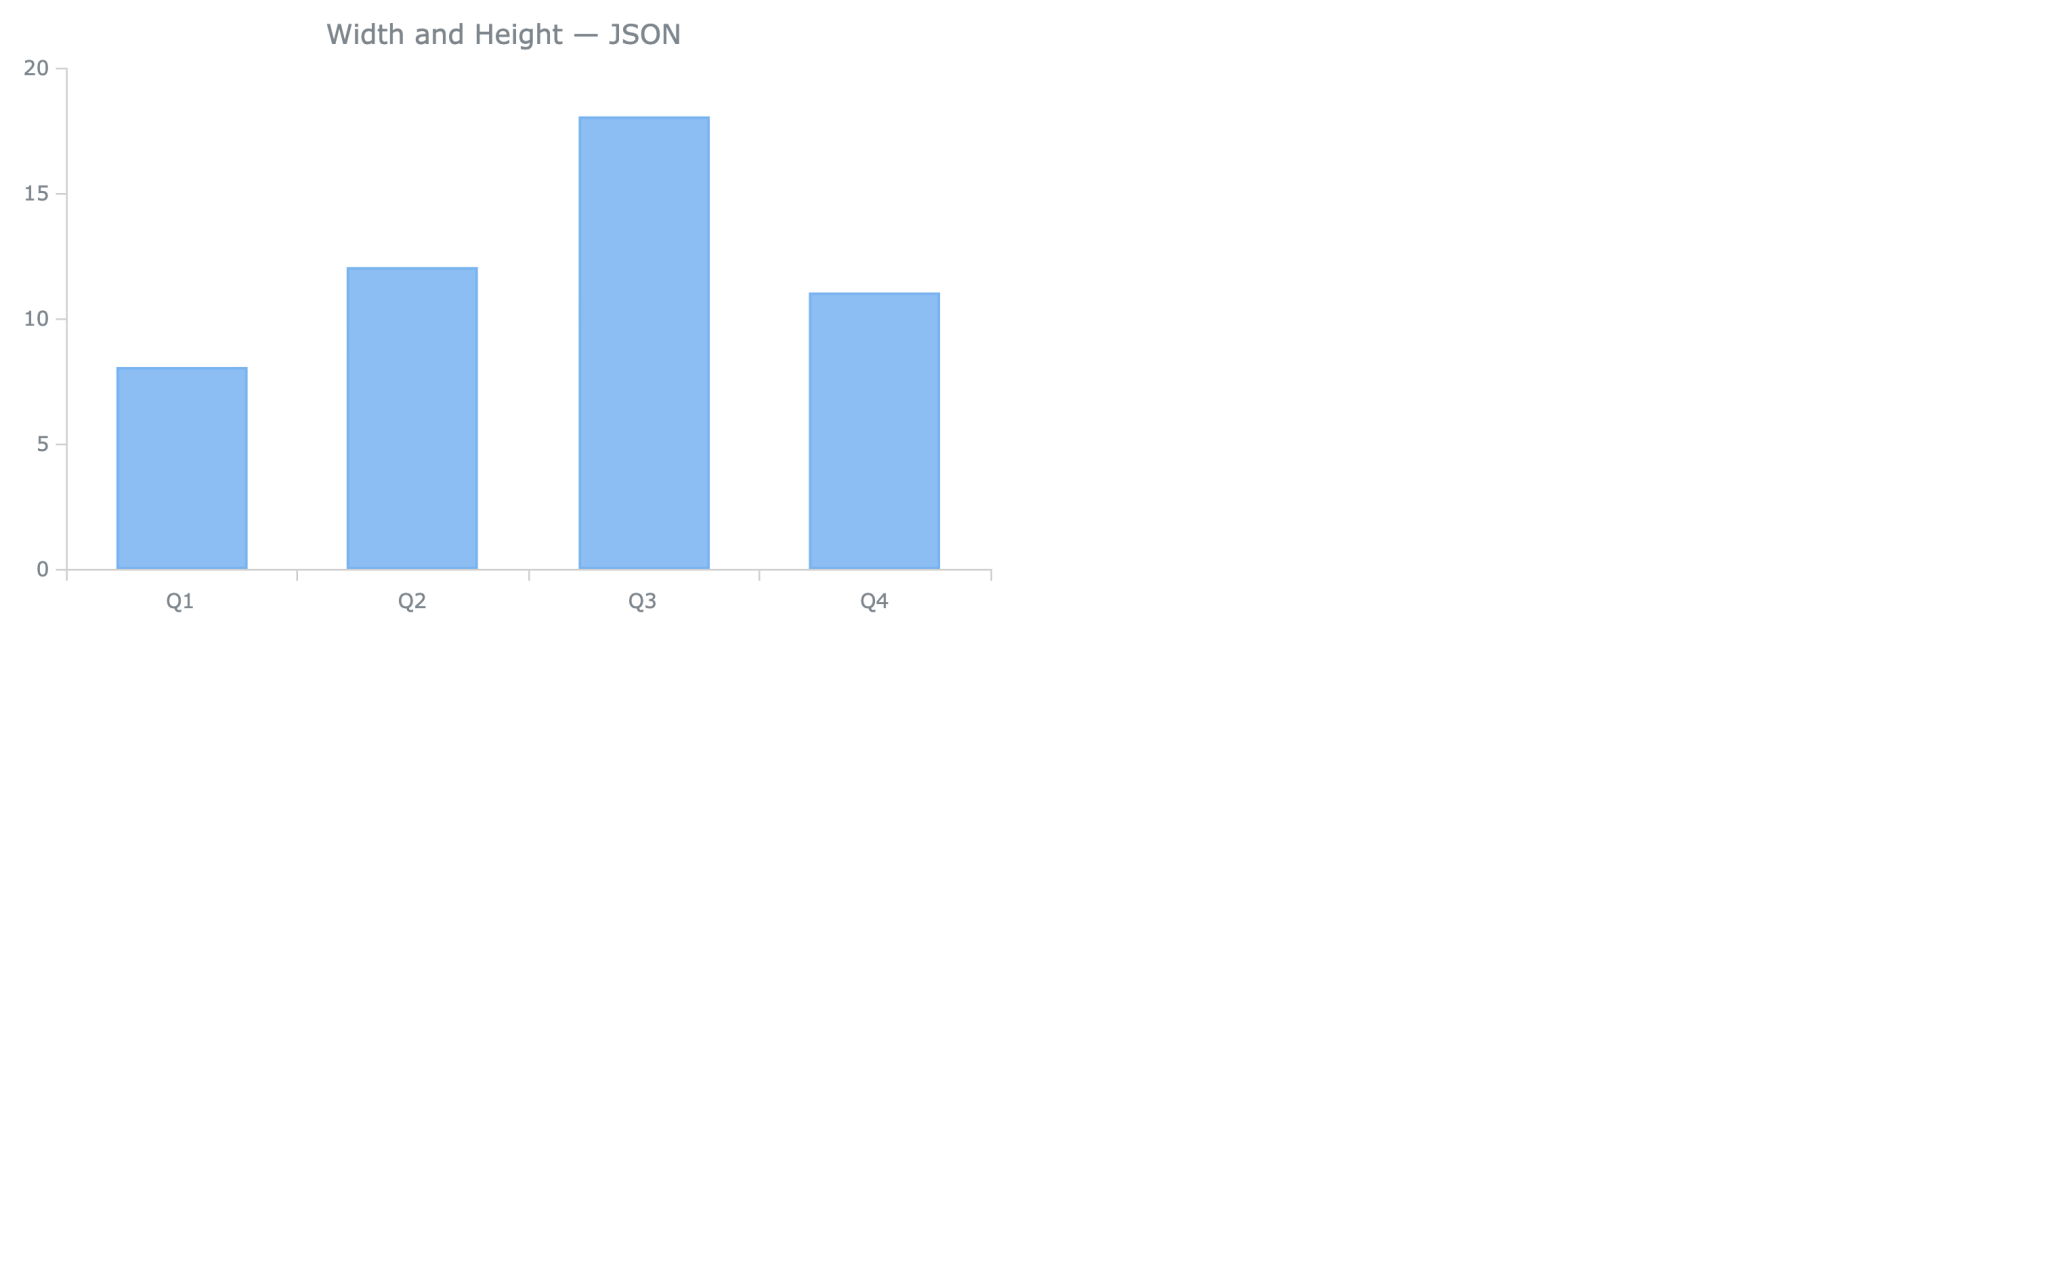
Solution 2: Configuring Height/Width in JSON
Overview
If your chart’s configuration is in JSON format, you likely already know that the name of every object in JSON corresponds to the name of a method or parameter in JavaScript. Height and width settings are no exception.
In Detail
Here’s how you can add the height setting to your JSON configuration:
"height": "50%",
Feel free to set the chart width identically:
"width": "50%",The entire JSON chart configuration with both settings described above can look as follows:
// configure json data
var json = {
  // configure the chart
  "chart": {
    // set the column chart type
    "type": "column",
    // set the chart height
    "height": "50%",
    "width": "50%",
    // set the chart data
    "series": [{
      "data": [
        {x: "Q1", value: 8},
        {x: "Q2", value: 12},
        {x: "Q3", value: 18},
        {x: "Q4", value: 11}
      ],
    }],
    // set the chart container
    "container": "container"
  }
};
Example
Check out an example of a chart where the height and width settings are defined in JSON configuration:
Solution 3: Configuring Height/Width in CSS Rules
Overview
Alternatively, you can specify the required width or height by adjusting the CSS rules of the block-level HTML element used as the container for your JavaScript-based chart.
In Detail
To set the desired height in CSS, use the height property. Likewise, configure the width with the help of width.
For instance, here’s how you can specify both custom height and weight:
#container {
  height: 50%;
  width: 50%;
}
Example
Check out an example of a chart where the height and width are set in the CSS rules:

Further Learning
These methods for controlling your chart’s size should work well in most situations. However, we understand that specific cases, like embedding charts in dashboards, might require a different approach. If you find yourself in such a situation, feel free to explore our documentation on creating dashboards. This will guide you through more advanced scenarios while ensuring everything remains straightforward:
Wrapping Up
Need help or have questions? Simply comment right here below or ask our Support Team directly.
Stay tuned for the JavaScript Chart Tips series on our blog as we’ll continue to share valuable tips and tricks inspired by recent support cases from our customers.
Enjoy your journey with JavaScript charting!
- Categories: AnyChart Charting Component, Dashboards, HTML5, JavaScript, JS Chart Tips, Tips and Tricks
- No Comments »