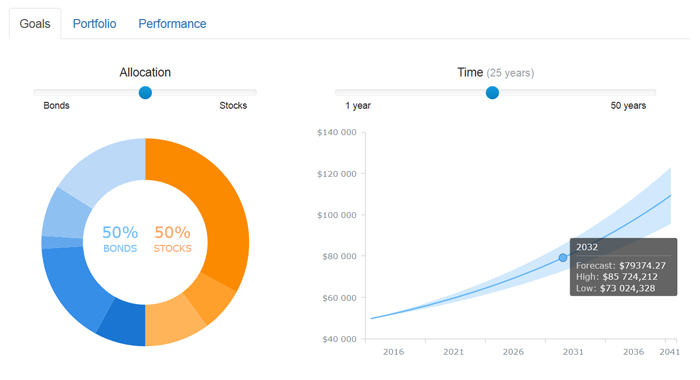
We have added a new dashboard to AnyChart Business Dashboard Solutions – a section of our site with sample dashboards demonstrating how AnyChart charting framework can be applied to various visualization tasks in various industries. Investment Portfolio Dashboard is a sample solution for personal portfolio management, based on data from finance.yahoo.com.
Some say that portfolio management is the art and science, which consists of making decisions about investment content combination and policy, matching investments to objectives, asset allocation for individuals and institutions, and balancing risk against performance.
If you want to be perfectly accurate, investment management is the professional asset management of various securities (shares, bonds, and other securities) and other assets (e.g., real estate) in order to meet specified investment goals for the benefit of the investors. Investors may be institutions (insurance companies, pension funds, corporations, charities, educational establishments, etc.) or private investors (both directly via investment contracts and more commonly via collective investment schemes e.g. mutual funds or exchange-traded funds).
Or, in plain English, managing investment porfolio is creating a collection of assets that can diminish the risk inherent in stock markets by diversification or avoiding having too many eggs in one basket.
Whatever the case is, any porfolio management must include the following steps: choosing investment horizon and goals, building portfolio, and performance monitoring. Each of the steps needs a dashboard of its’ own, so there are three tabs in our dashboard: Goals, Portfolio, and Performance.
The Goals tab provides a user with a way to mix the portfolio and a way to see the prognosis for it, so there are two charts: a Donut chart and a combination of a Line chart and a Range Area chart. The Portfolio tab shows the mix of the instruments and all basic information about them (here you see the same Donut chart and a table). Finally, in the Performance tab you will find a Stock chart demonrtrating the performance of our investment porfolio.
Using AnyChart, we have created a user-friendly and fast-rendering visualization. To learn how it was done, you can see a detailed tutorial: Creating Investment Portfolio Dashboard. Our dashboard is minimalistic, but it can be easily extended, and it does not matter how much additional information you need to show: our charting framework is flexible enough to cope with any task.
- Categories: AnyChart Charting Component, AnyStock, HTML5, JavaScript, News, Stock Charts, Tips and Tricks
- 1 Comment »
