 Visualizing data from a literary work can clarify complex structures and patterns, enhancing the understanding of its content and context. For example, a timeline chart can effectively organize events mentioned in the text into an intuitive graphical form, which can be especially beneficial for historical texts. Today, we are pleased to share a project where AnyChart was instrumental in clearly revealing this temporal aspect.
Researchers from the Austrian Academy of Sciences (ÖAW, for Österreichische Akademie der Wissenschaften) have created an expanded digital edition of Third Walpurgis Night by Karl Kraus, an esteemed Austrian writer and satirist, who was nominated three times for the Nobel Prize in Literature. Written in 1933 but published only posthumously in 1952, this essay provides a critical analysis of the early National Socialist rule in Germany. The digital edition integrates the original text into its historical context with extensive commentary, glossary entries, and now also an interactive timeline developed using our JavaScript charting library.
Learn more about the project and how it employs AnyChart in our conversation with Bernhard Oberreither and Barbara Krautgartner from the Austrian Center for Digital Humanities and Cultural Heritage (ACDH-CH) at the ÖAW, who brought this project to fruition. (Stack: eXist-db/TEI Publisher.)
AnyChart: To begin, could you please introduce yourselves to our community?
Bernhard Oberreither: We both work at the Austrian Centre for Digital Humanities and Cultural Heritage in Vienna. I am a literary scholar within the Literary and Textual Studies research unit, focusing on digital editions.
Barbara Krautgartner: I am part of the Digital Humanities Research and Infrastructure research unit, and I am mainly involved in web development and data processing.
A: Could you tell us about your project and its value?
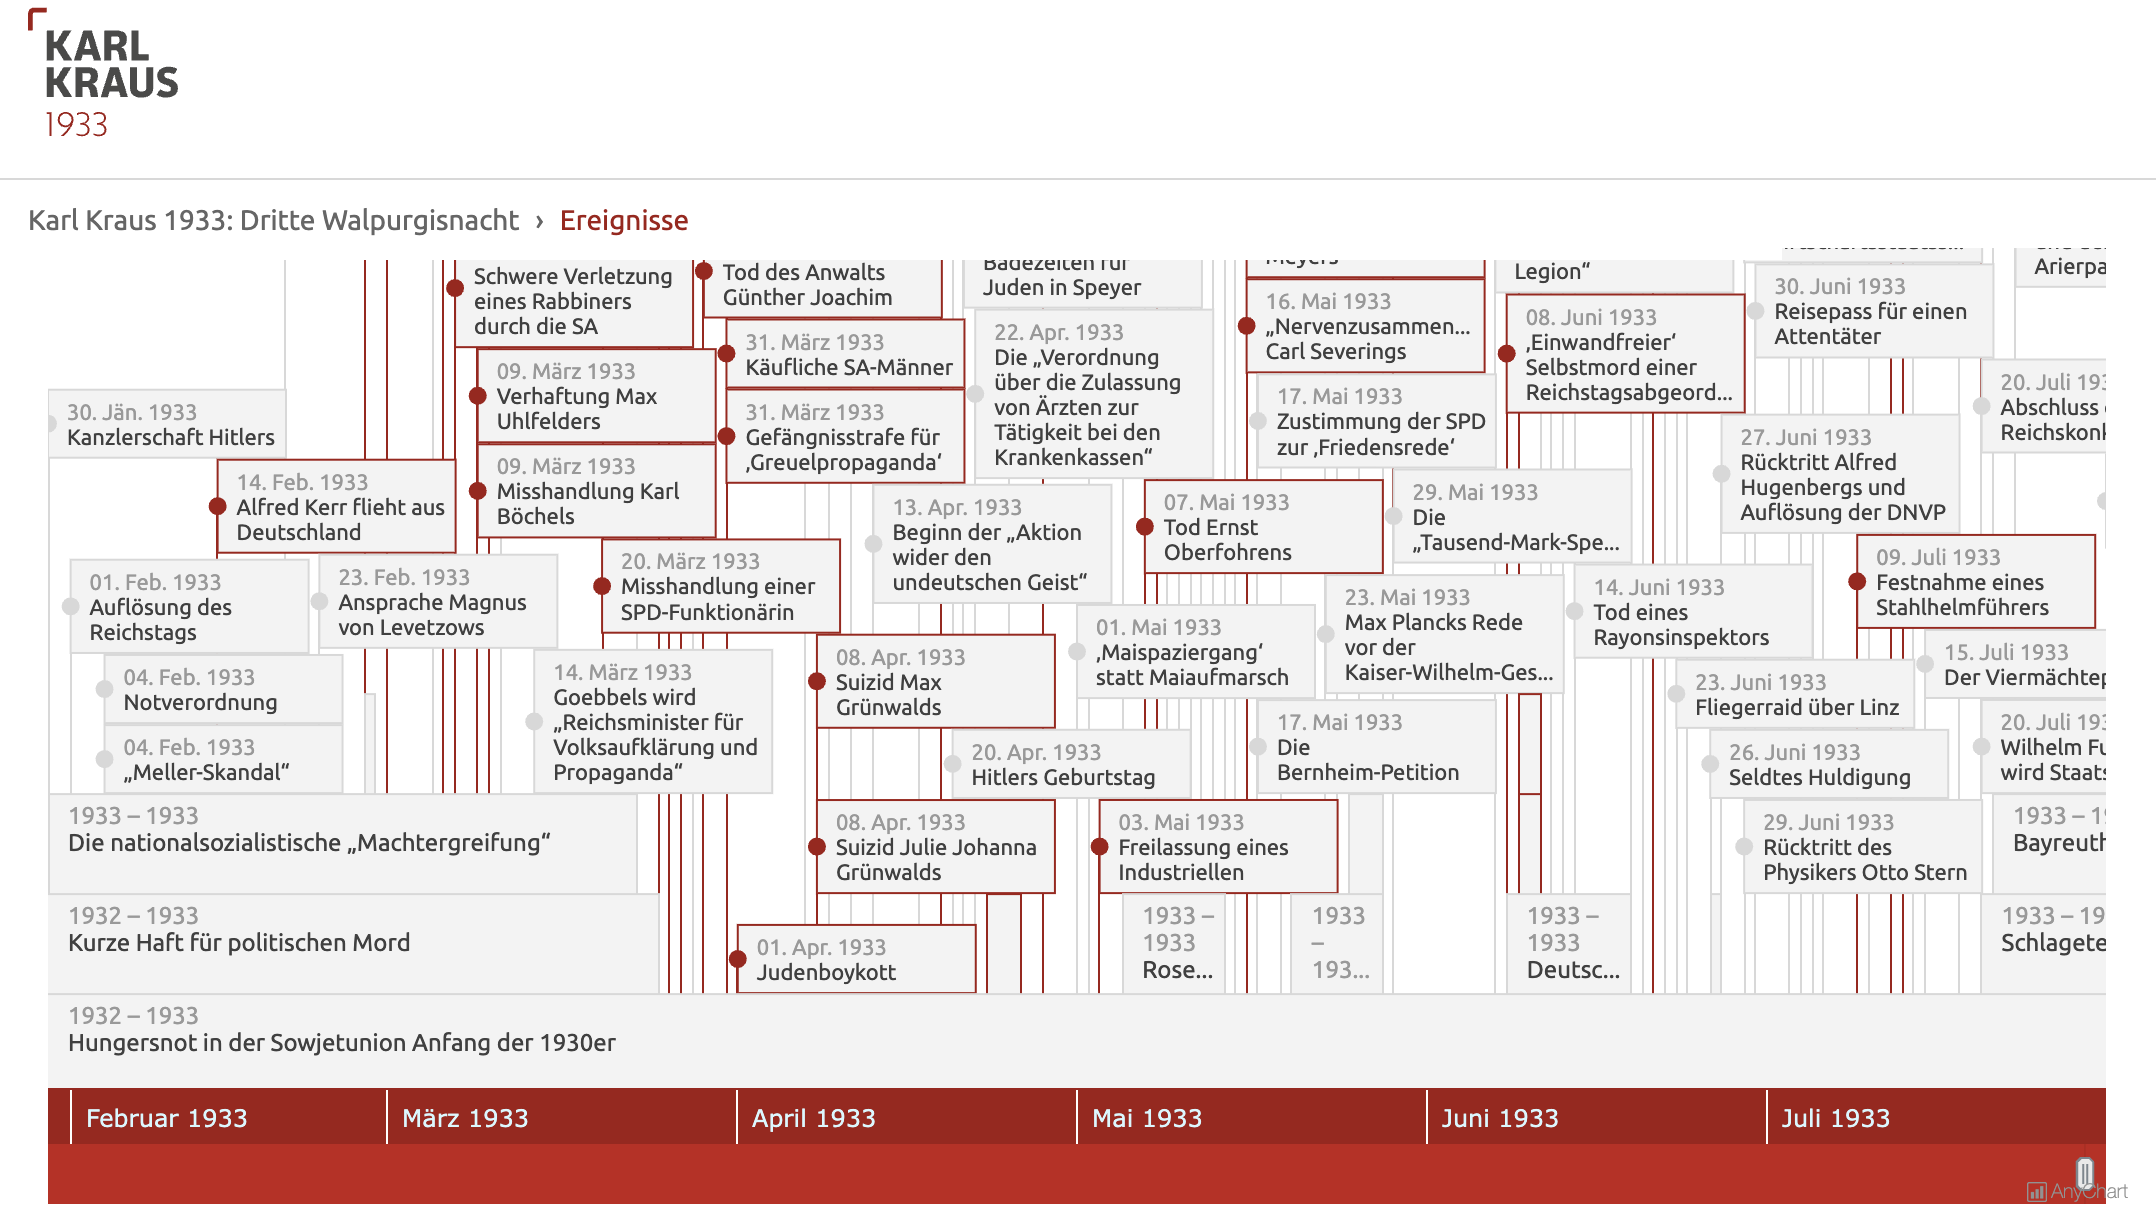
BO: From March to September 1933, Austrian satirist Karl Kraus documented and commented on the National Socialist takeover in Germany, the violence on the streets and in the early concentration camps, the regime’s propaganda lies, and the reactions of his contemporaries. The result was his text Third Walpurgis Night (Dritte Walpurgisnacht in German), which was published in 1952, posthumously.
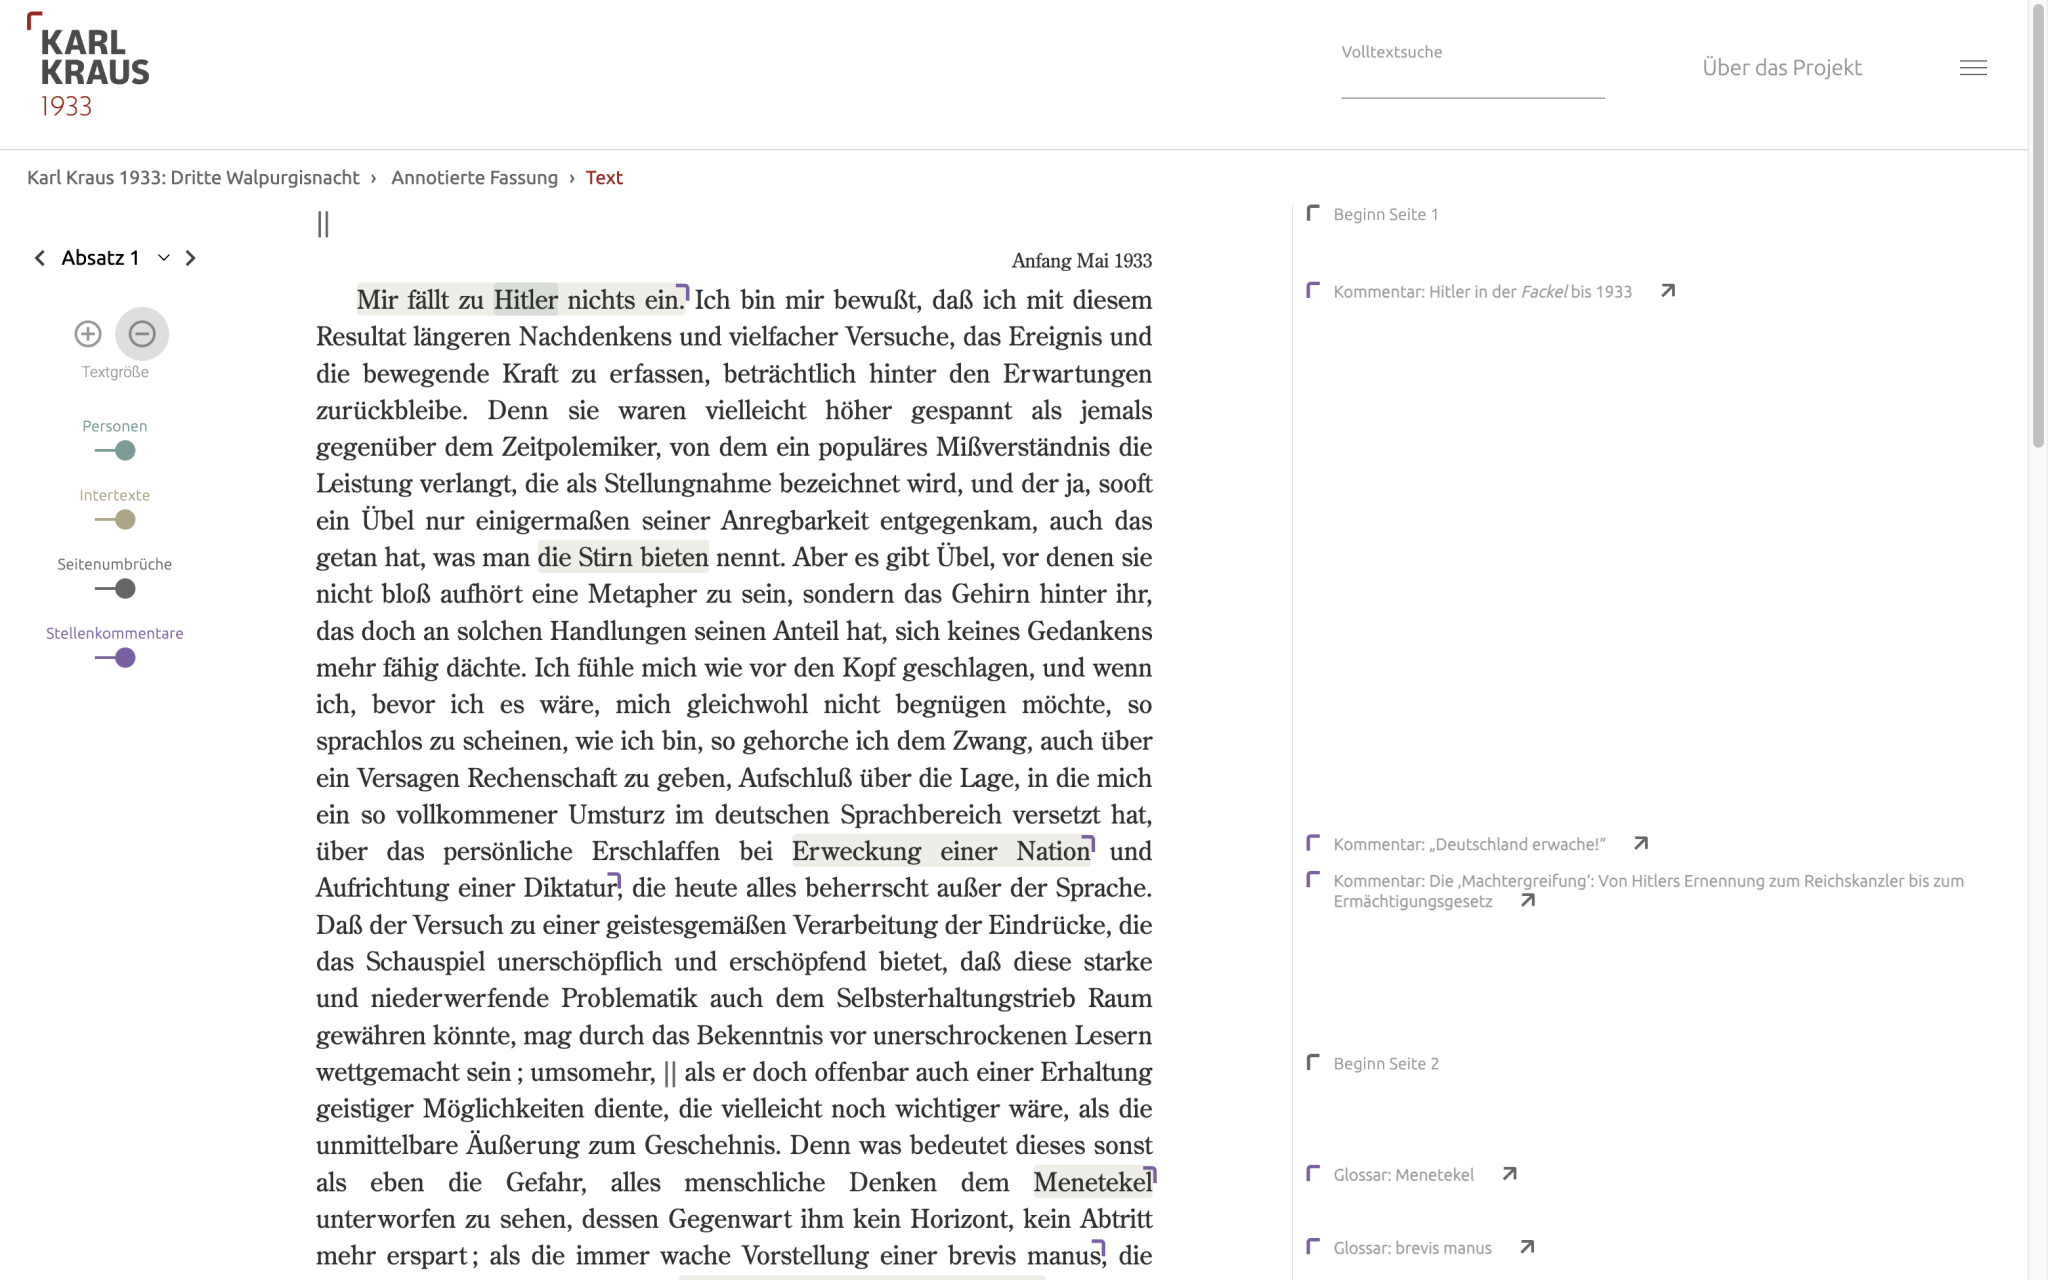
At the ACDH-CH, we created a digital scholarly edition of this literary work, which includes commentaries on the original text, as well as notes and glossary entries. This project aims to provide a crucial historical context that may otherwise be inaccessible to modern readers, helping to make Kraus’s linguistically powerful and insightful first-hand commentary on the Nazi takeover in Germany understandable today.
A: How did your project develop over time?
BO: Third Walpurgis Night was made available as an open-access digital edition through several stages. The first step was the publication of the hard-to-read notes with decipherments in 2019. An annotated reading version has been available online since May 2021, containing information on the persons named and on literary and journalistic intertexts. The next publication step took place at the beginning of 2024 and includes a commentary and a timeline.
A: How did AnyChart contribute to your project?
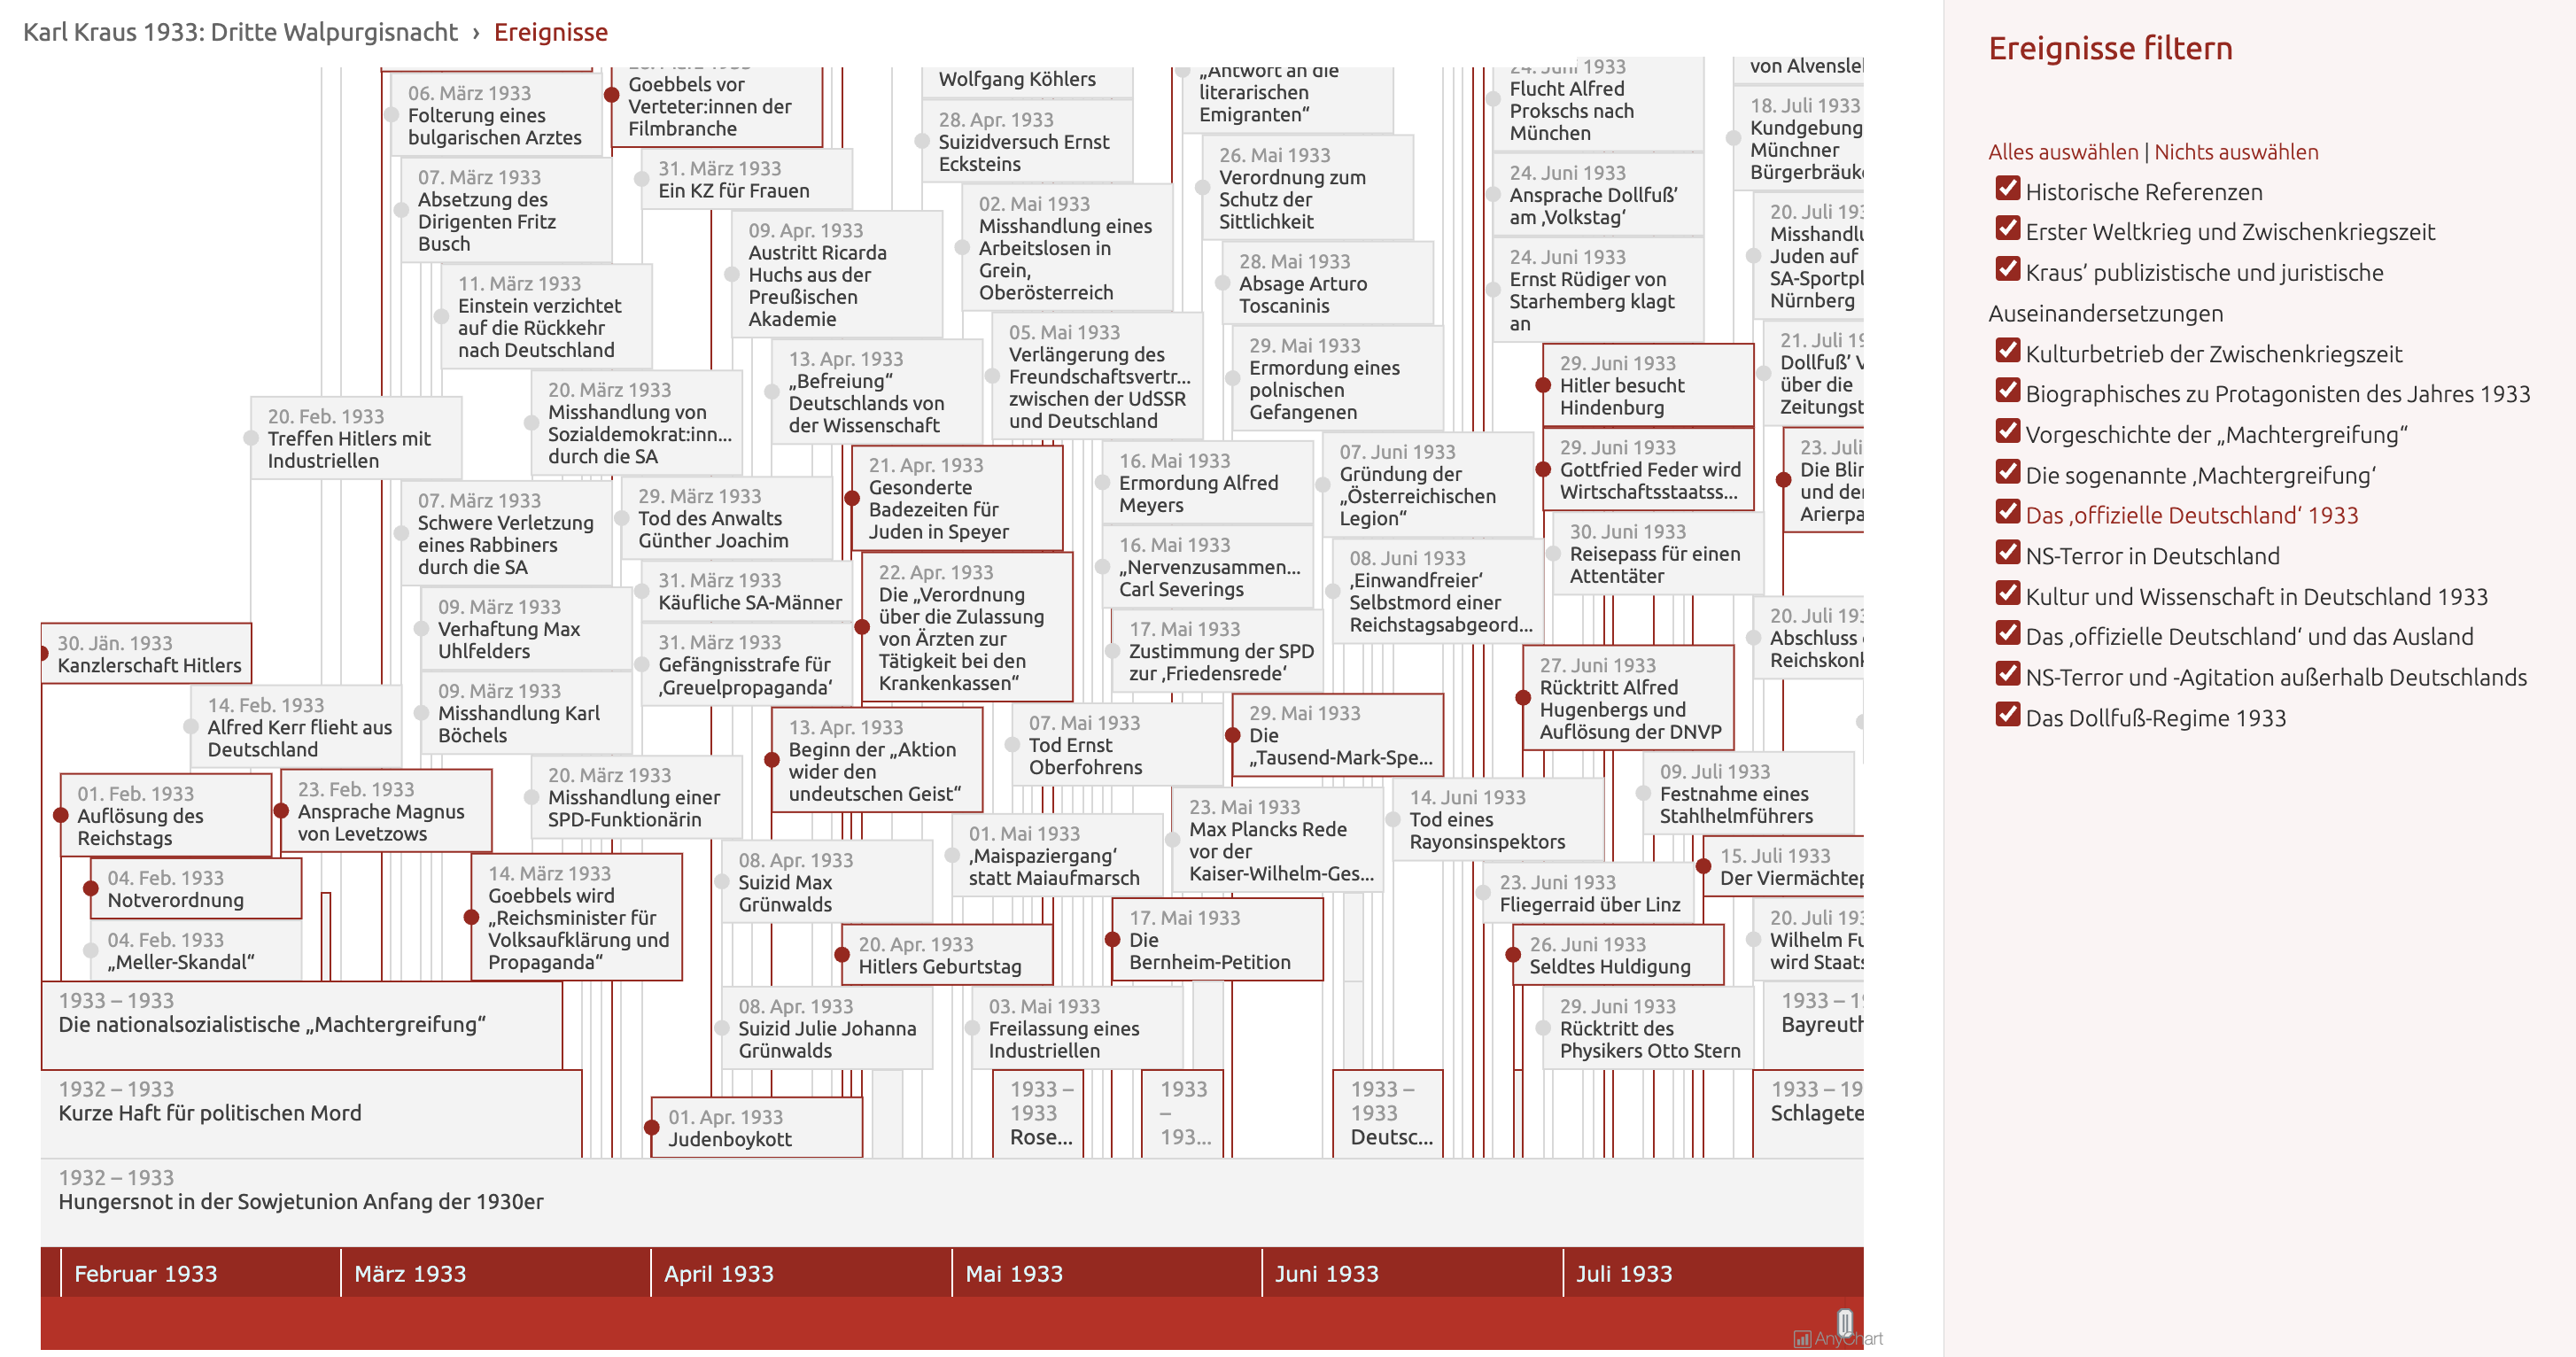
BO: Karl Kraus documented hundreds of events, big and small, that shaped the early stage of National Socialist rule in Germany. We wanted to present them in a clear and engaging format, and that’s where AnyChart came into play as a tool for creating our interactive timeline. This visualization provides the opportunity to view all the events, explore them in context, and enter Kraus’s text from many different points.
A: How did you discover AnyChart, and what made you choose it for your project?
BK: We found AnyChart through a Google search. With limited time for implementation, the timeline chart examples provided online suggested that AnyChart would meet our needs, which turned out to be the case. While we work on a wide range of very specific projects at our institute, varying in data formats, design, and interactivity requirements, we didn’t have any prior experience with AnyChart, but this experience appeared to be positive.
A: Could you share more about the technical aspects of your project? What technology stack is it built on?
BK: At the core of our project, we work with XML files following the TEI schema, which is commonly used in scholarly digital edition contexts. These files are hosted in an XML database called eXist-db, which processes and transforms the data via XQuery and XSLT.
The creators of eXist-db developed a backend app and frontend components to help the community with data publishing. We are using their TEI Publisher, an eXist-db app that processes the data and delivers our content via REST. For the frontend, we are using TEI Publisher’s web components. I also extended the backend to deliver the correct JSON data to the AnyChart JS library based on our XML input. On the frontend, I just went with Vanilla JS.
Soon, we plan to relaunch the project as static HTML.
A: Was integrating AnyChart smooth, or did you face any significant issues?
BK: Using AnyChart in our project was pretty straightforward. We encountered two challenges that I can recall. First, the team initially considered a vertical timeline layout. I couldn’t find a way to implement this, but we ultimately decided that a horizontal view suited our needs better anyway. Second, I had issues with the correct display of dates before the year 100, like 0037-03-18. (Editor’s note: A solution has been provided in the meantime by AnyChart’s Support Team.)
A: What improvements or additional features would you suggest for AnyChart?
BK: It would be helpful to have a Q&A area for designers. Sometimes we work with designers who lack the technical background or time to fully explore the API reference and documentation, so developers need to explain available visualization options in advance. For example, to ensure the designer comes up with an implementable shape for moment series markers, I need to inform them about the marker types to choose from.
A: When suggesting a JavaScript library for data visualization to a friend or colleague, would you recommend AnyChart?
BK: For the time being, I only worked with your timeline chart. I definitely recommend AnyChart for use cases like ours, where a robust interactive timeline of events is needed. With correct data input, this library is pretty straightforward to create a nice graph quickly.
A: Thank you for your time and for using our JS charting library. Wishing you continued success!
Have a story to tell about your experience with AnyChart? Don’t hesitate to get in touch!
Explore more customer stories on our blog.
Also, take a look at the ÖAW case study, which has just been added to our selected case studies.
- Categories: AnyChart Charting Component, Big Data, HTML5, JavaScript, Success Stories, Third-Party Developers
- No Comments »