 Stock charts are designed to handle large volumes of time-based data, and smooth navigation is key to working with them effectively. One common need is zooming — whether to focus on a specific time range in greater detail or to get a broader view of the data.
In our JavaScript stock charts, zooming works out of the box through the scroller element, which appears by default as the main navigational UI control, making it easy to adjust the visible range on the go. For even greater flexibility, the range selection UI provides extra tools like preset time period buttons and date input fields. You can also activate zooming via mouse wheel scrolling with the zoomOnMouseWheel() method, which corresponds to the two-finger swipe gesture on touchpads and trackpads.
Pinch-to-zoom is another intuitive zooming option. It allows users to zoom in and out naturally on mobile and touch devices by moving two fingers farther apart or closer together. This is also easy to implement — and it is exactly what we cover in this edition of JS Chart Tips. Learn how to add pinch-to-zoom to your JavaScript stock chart!
Question: How to Add Pinch-to-Zoom to JavaScript Stock Chart?
Recently, our Support Team received several questions about enabling pinch-to-zoom in our JavaScript stock charts. Since this feature provides a smooth and intuitive way for users to zoom in and out of time-based data using familiar gestures — particularly on mobile — we figured it would be helpful to share the solution publicly, not just with those who reached out.
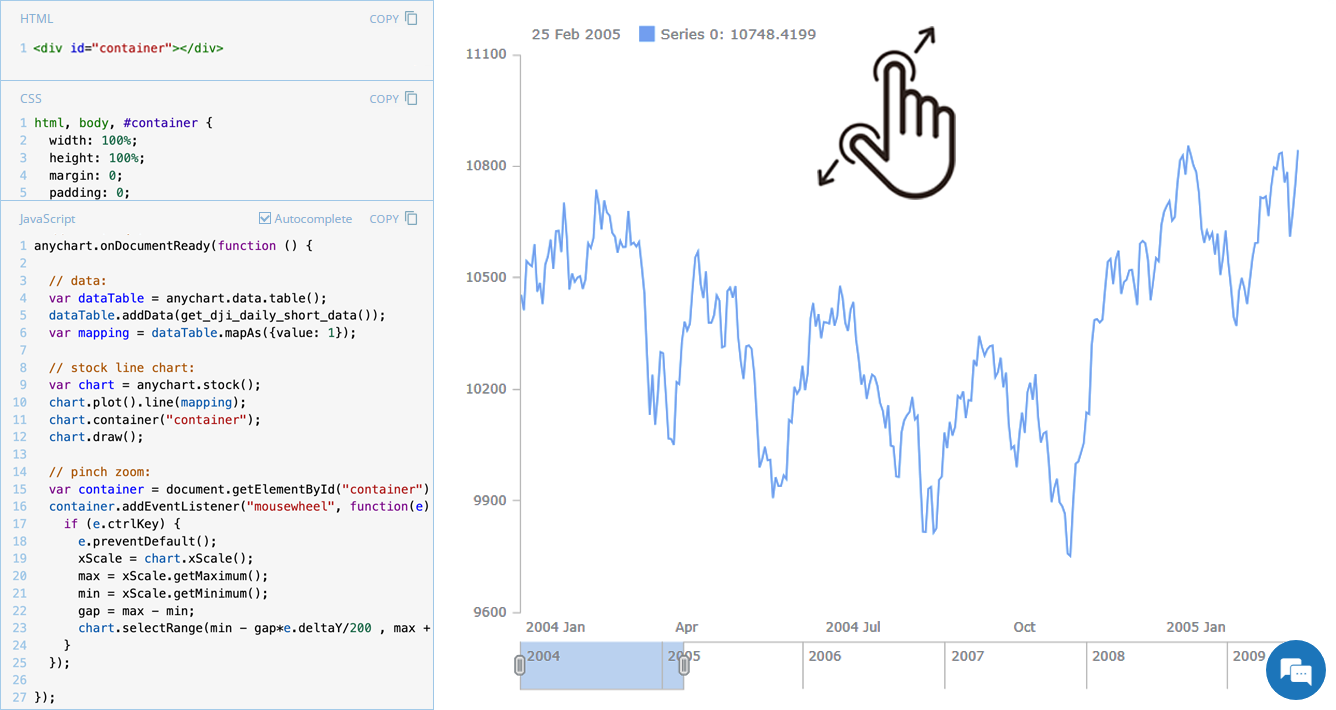
Here is an animation showing the pinch zoom behavior we are talking about — zooming in or out of the timeline with a simple two-finger pinch gesture:
So, how exactly can you add pinch zooming? Let us show you! Below, we will walk you through how to enable pinch-to-zoom functionality in a stock chart using JavaScript.
Solution: Implementing Pinch Zoom in JS Stock Charts
Overview
Pinch-to-zoom essentially mirrors the behavior of holding Ctrl (or Cmd on Mac) while scrolling the mouse wheel. So, the solution involves capturing mouse wheel events triggered when the user scrolls while holding Ctrl/Cmd, preventing the default browser behavior (which would otherwise zoom the page), and dynamically adjusting the chart’s visible range by updating the X-axis scale.
This approach provides smooth, intuitive zooming — whether users scroll while holding Ctrl/Cmd or perform a pinch gesture.
Now, let’s see how this can be implemented with just a few lines of code.
In Detail
First, assuming you have already created a stock chart, access the container where the chart is rendered. You can do this by selecting the container element using document.getElementById:
var container = document.getElementById("container");Second, add an event listener to detect when the user scrolls while holding Ctrl (or Cmd on Mac). This is done using the mousewheel event:
container.addEventListener("mousewheel", function(e) {
  // ensure zooming only happens when Ctrl (or Cmd on Mac) is pressed
  if (e.ctrlKey) {
    // prevent the default browser zoom behavior
    e.preventDefault();
    // zoom logic will go here
  }
});
Third, once a zoom event is detected, dynamically update the X-axis scale to zoom in or out by adjusting the visible range:
// retrieve the x-axis scale
var xScale = chart.xScale();

// get the current visible range
var max = xScale.getMaximum();
var min = xScale.getMinimum();

// calculate the current range
var gap = max - min;

// update the range dynamically
chart.selectRange(min - gap * e.deltaY / 200, max + gap * e.deltaY / 200);
That is basically it — your stock chart now supports pinch-to-zoom behavior.
For reference, here is the complete code, combining all the steps above:
var container = document.getElementById("container");
container.addEventListener("mousewheel", function(e) {
  if (e.ctrlKey) {
    e.preventDefault();
    xScale = chart.xScale();
    max = xScale.getMaximum();
    min = xScale.getMinimum();
    gap = max - min;
    chart.selectRange(min - gap*e.deltaY/200 , max + gap*e.deltaY/200);
  }
});
Example
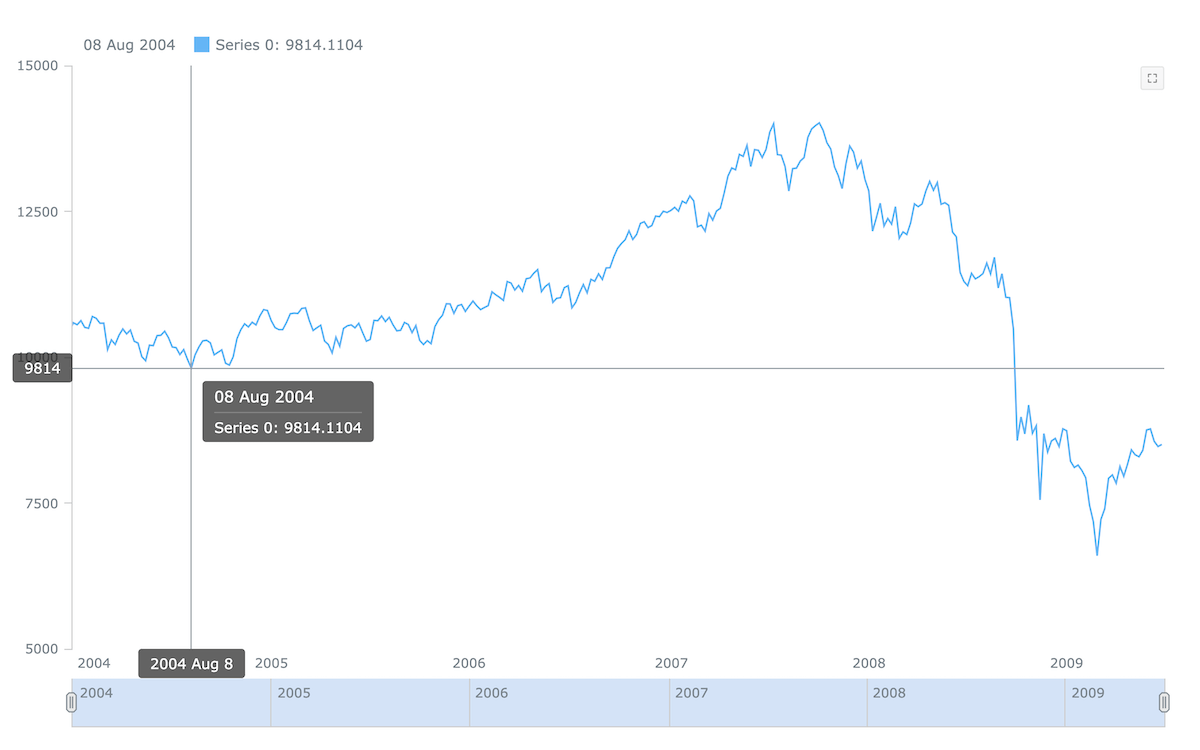
Check out an example of a stock chart with pinch-to-zoom, and feel free to experiment further with its code and visualization:
Further Learning
Learn more in our JavaScript charting documentation:
Wrapping Up
Now you know how to add pinch-to-zoom support to your JavaScript stock chart, making navigation even more intuitive with familiar touch gestures and scroll actions.
Keep following the JS Chart Tips series for more practical solutions inspired by real-world cases and feature requests from our customers. If you have any questions or need assistance, our Support Team is always ready to help.
Enjoy smooth zooming into your data with our JavaScript charts!
- Categories: AnyChart Charting Component, AnyStock, Big Data, Financial Charts, HTML5, JavaScript, JS Chart Tips, Stock Charts, Tips and Tricks
- No Comments »