 We are pleased to share that EODHD APIs, a prominent provider of financial market data, selected our JavaScript charting library to power charts in their new Online Currency Converter.
The tool provides free access to both live and historical exchange rates for more than 1,100 currency pairs. Interactive stock charts, built with our specialized AnyStock product, enrich numerical conversion data with clear visual context, providing insight into currency dynamics over time.
This case highlights how charts built with AnyChart can add clarity and usability to financial tools. Let’s take a closer look at how it works.
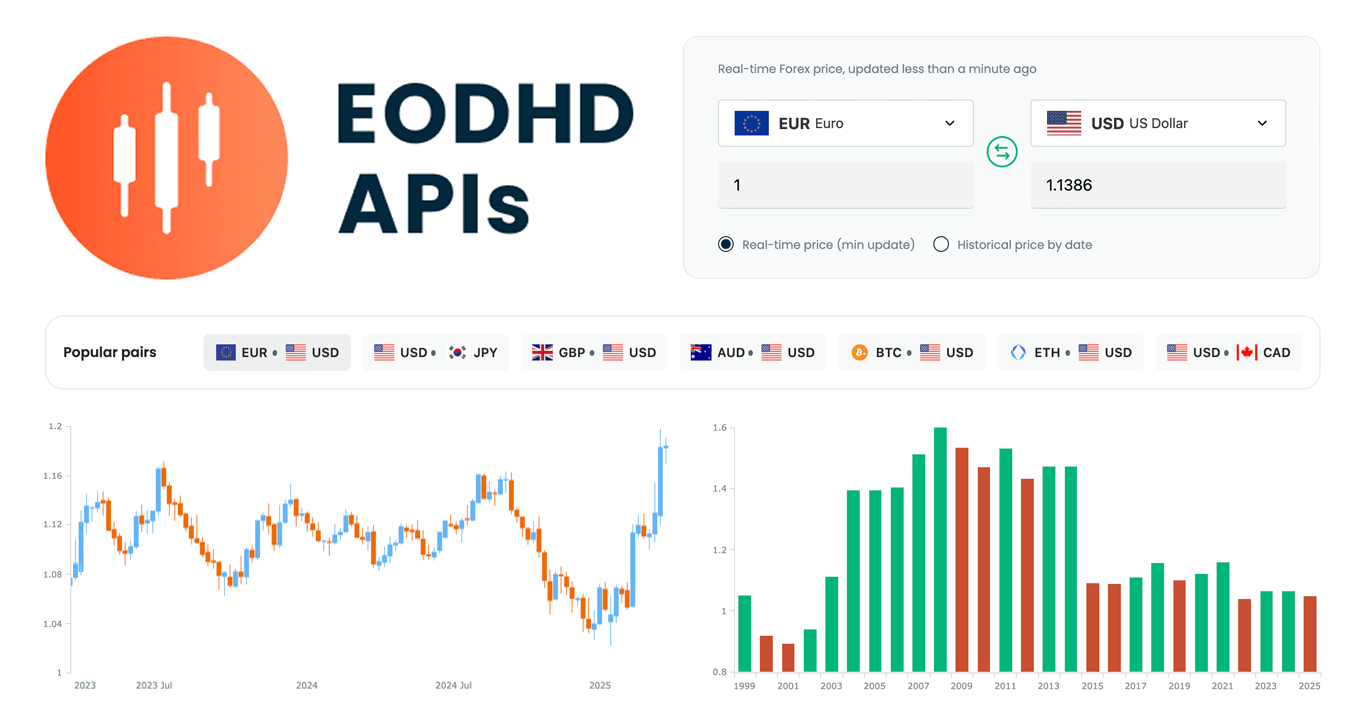
Currency Exchange Rate Conversion Tool
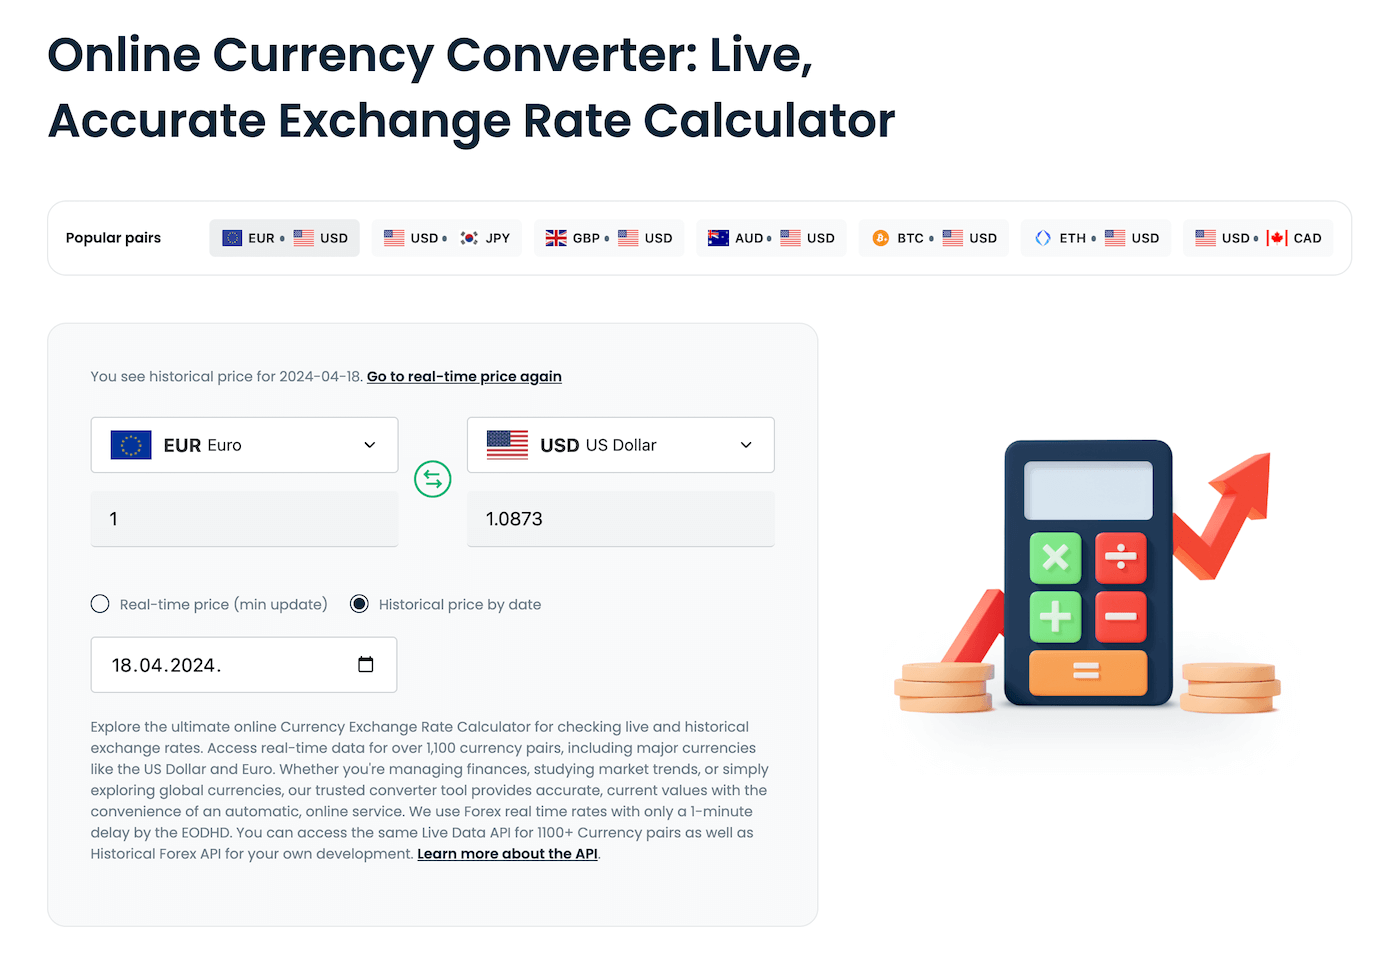
Freely available to everyone, EODHD APIs’ Online Currency Converter comprises several sections, each designed for a specific task.
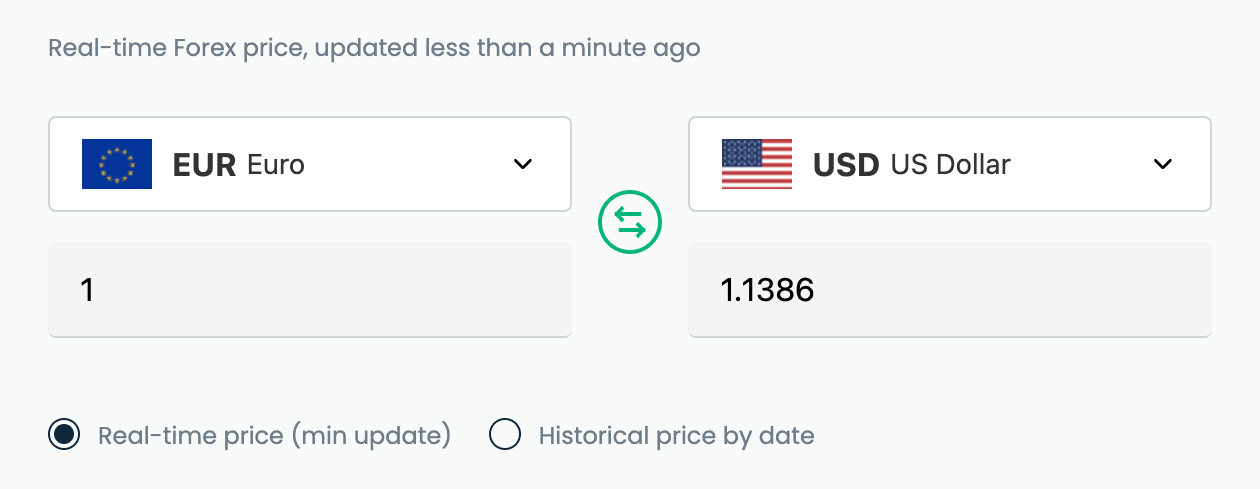
At its heart is the intuitive exchange rate calculator. Users select a currency pair from an extensive list of over 1,100 options, including major fiat currencies such as USD and EUR, as well as popular cryptocurrencies like BTC and ETH. Current conversion rates are instantly displayed based on real-time Forex data, updating every minute to ensure accuracy.
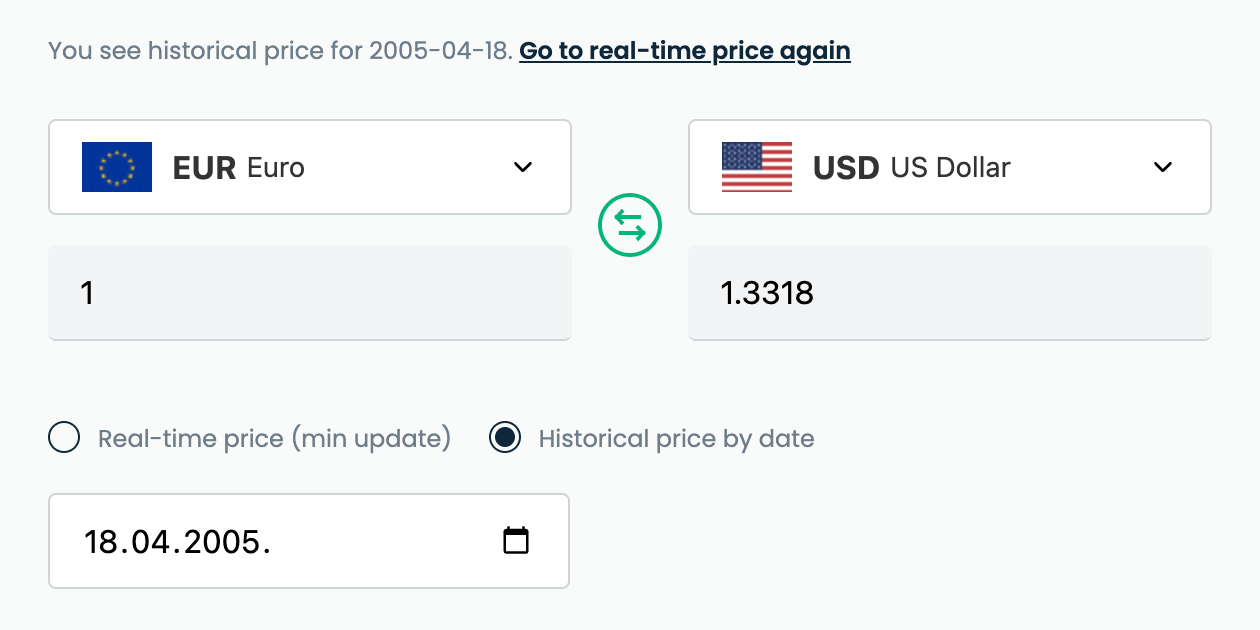
A historical view mode is also available. It allows users to select any date in the past and retrieve the exchange rate for that day.
Visual Tools for Historical Currency Analysis
In addition to showing the numbers, the converter incorporates robust visual currency analytics. Specifically, it offers two interactive stock chart graphics powered by our JavaScript stock charting solution. Yes, this is exactly where AnyChart comes to shine, making historical financial data easier to interpret through informative visualizations.
Candlestick Chart for Forex Price History
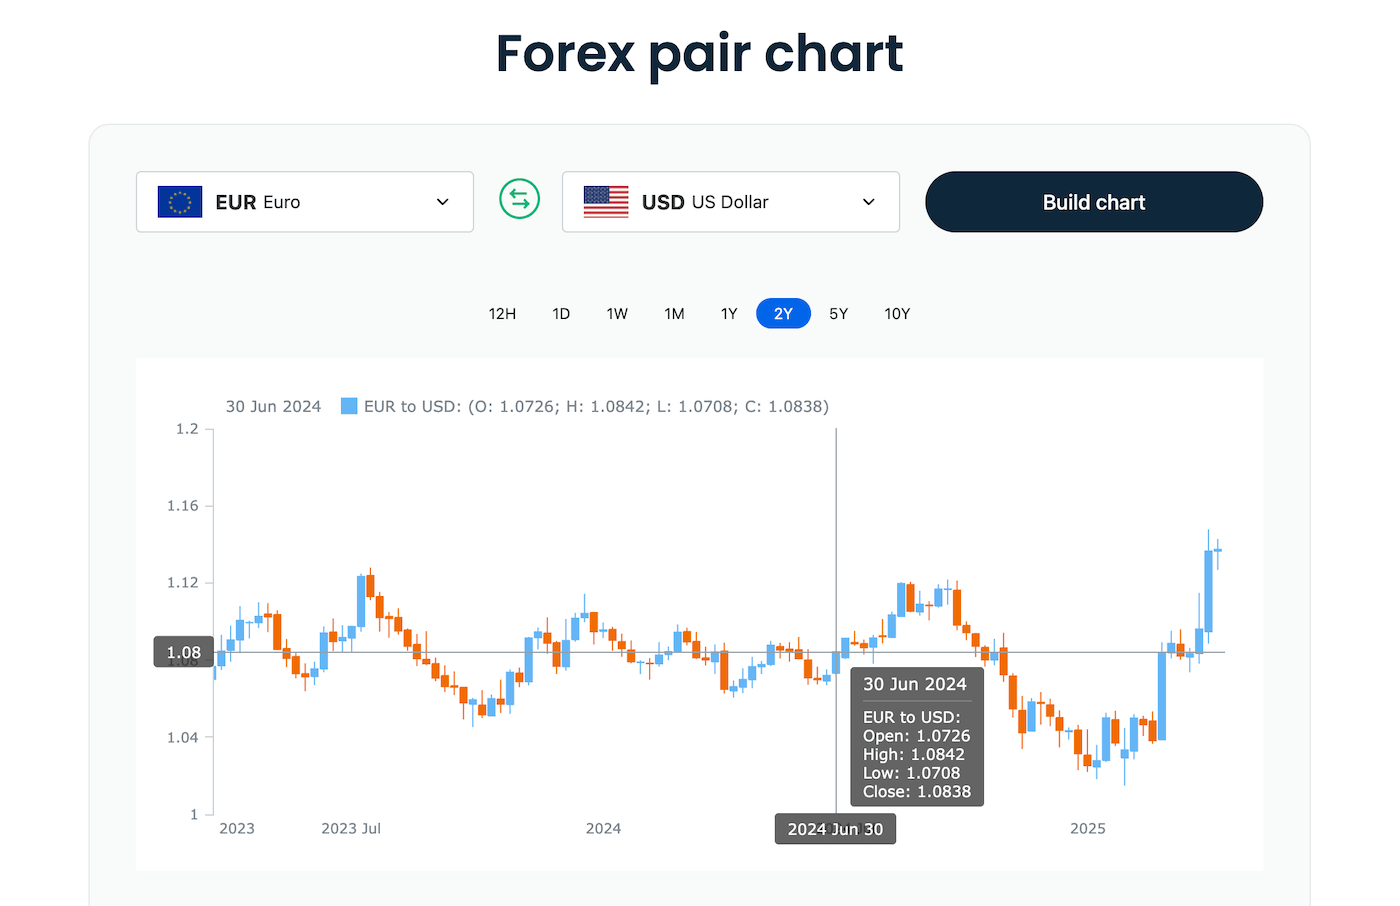
In the Forex Pair Chart section, users can analyze historical Forex prices in an interactive candlestick chart.
After selecting a currency pair and clicking the “Build chart” button, a stock chart with a candlestick series appears, showing open, close, high, and low prices over time.
Range selection buttons allow users to easily choose the desired timeframe — from 12 hours to 10 years — making the chart suitable for short-term volatility checks and long-term trend analysis alike.
Column Chart for Average Historical Forex Prices
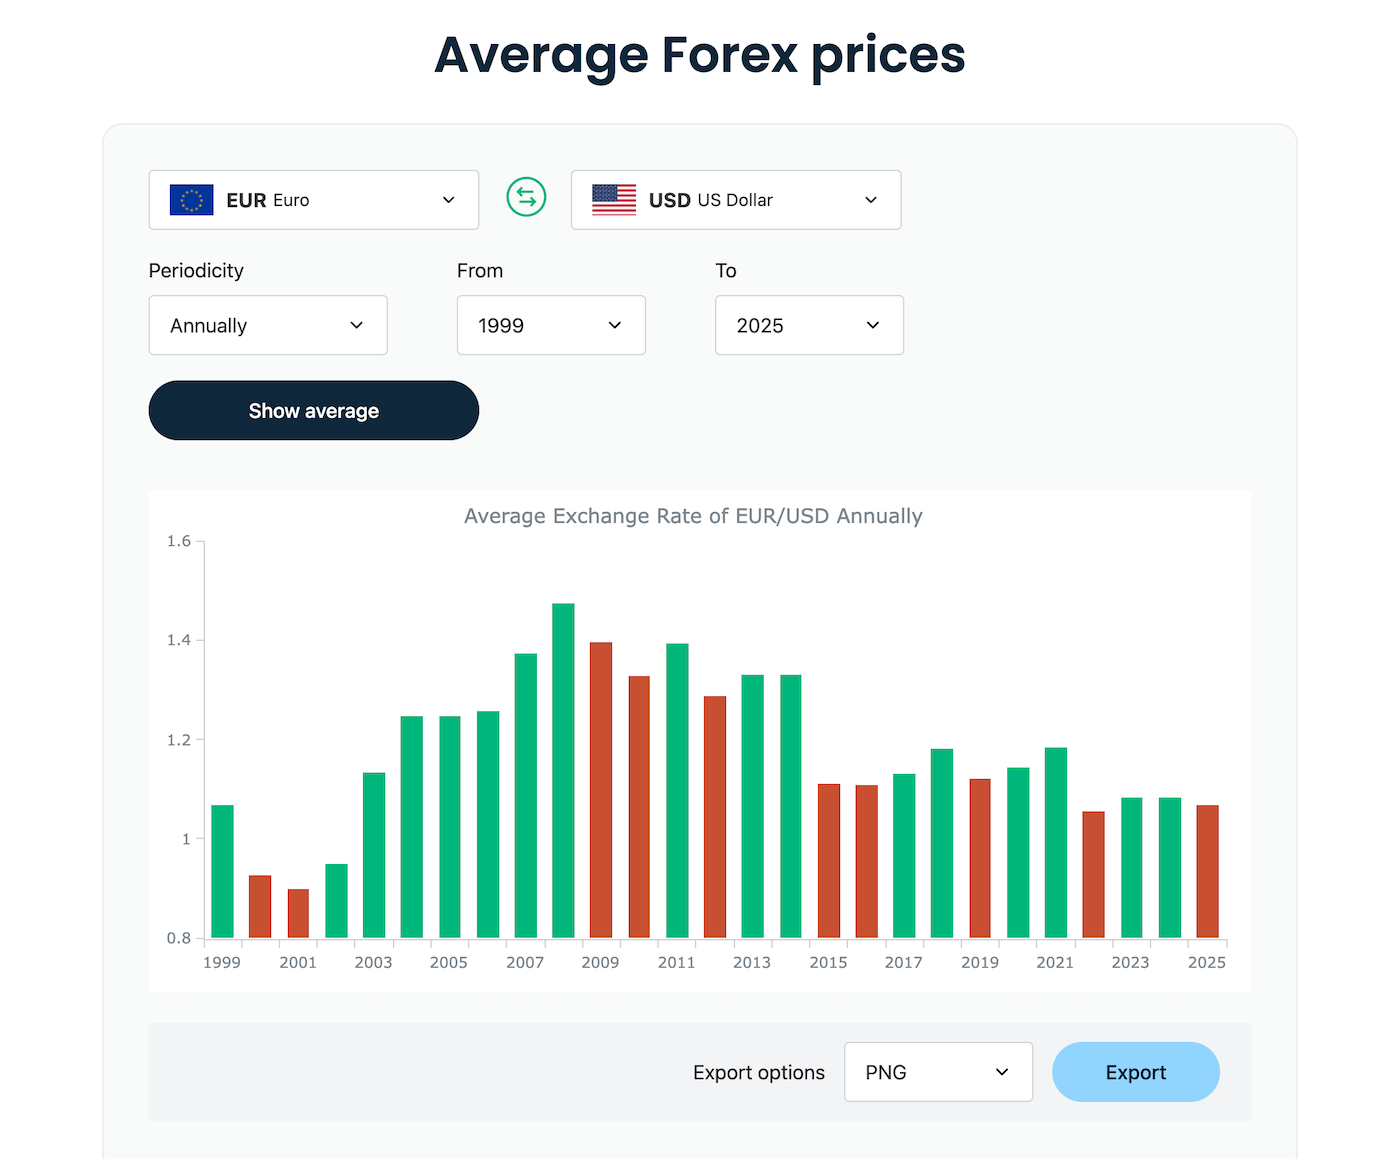
The Average Forex Prices section provides an interactive column chart (vertical bar chart) showing average historical Forex prices over time.
Users select a currency pair, choose whether to visualize monthly or yearly averages, define a time range, and click “Show average.” The result is a stock chart with a column series, supporting big-picture trend analysis.
Additionally, this visualization includes built-in export options, allowing users to download the chart in PNG, CSV, or Excel formats for further use, such as reporting or presentation purposes.
Financial Data & Visualization in Action
EODHD APIs’ Online Currency Converter is a great tool for checking both current and historical exchange rates across a wide range of currency pairs. With accurate information, a user-friendly interface, and helpful visual features, it serves a broad audience — from analysts and traders in need of a quick reference to anyone occasionally exploring currency values.
At the same time, it stands as a real-world example of how built-in visualizations can enhance financial tools. By embedding interactive JS charts built with AnyChart, the converter makes it easier to spot trends, compare changes over time, and get a clearer picture — all without requiring users to leave the interface or analyze raw numbers on their own.
Whether you are developing a public-facing service or an internal product, this project shows how thoughtful chart integration can add context, clarity, and usability.
Take a look at the Online Currency Converter to see how it works in practice. And if you are building a financial product of your own — whether for the web, mobile, or desktop — AnyChart is here to support all your data visualization needs.
- Categories: AnyChart Charting Component, AnyStock, Big Data, Financial Charts, HTML5, JavaScript, News, Stock Charts, Third-Party Developers
- No Comments »