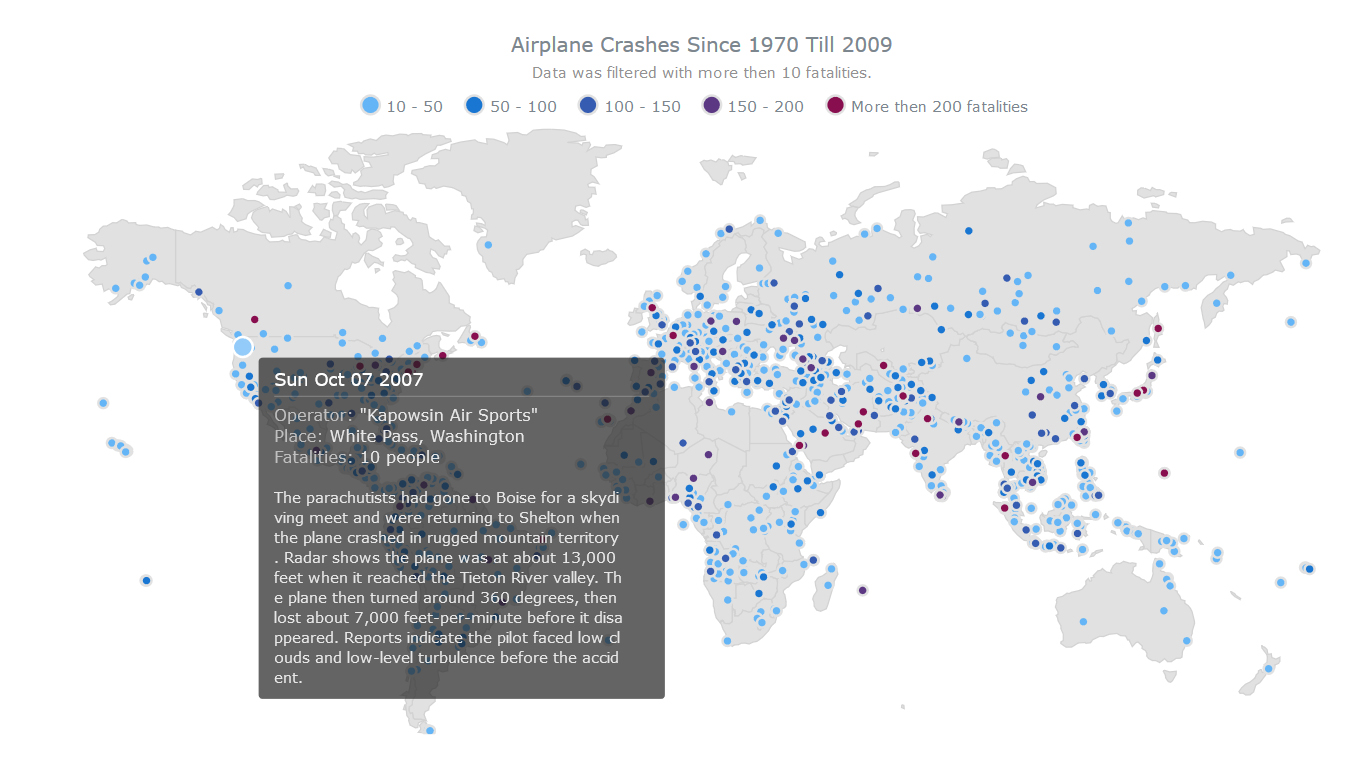
This week we have shared with you on AnyChart Facebook Page and in Twitter a few data visualizations – including a JavaScript Dot Map by AnyChart. You will find a recap of these posts below.
- Holyrood elections see rise of ‘Team Ruth’ and demise of Labour vision – The elections in Scotland have seen the remarkable transformation of Ruth Davidson’s Scottish Conservatives from “toxic Tories” to the second party and official opposition of the Holyrood parliament. In this article on Theguardian.com, you can see a couple of nice interactive charts showing the change in Scotland’s political geography.
- 24 Charts of Leadership Styles Around the World – Look at 24 charts of leadership styles around the world (from the book When Cultures Collide by Richard D. Lewis) and see how remarkably different these styles are, varying from structured individualism in USA and multiple leadership in Israel to national romanticist in Poland and human force in Spain, including some really tricky styles that cannot be described in one term.
- Digital Attack Map is a live data visualization of DDoS attacks around the globe, built through a collaboration between Google Ideas and Arbor Networks. The tool surfaces anonymous attack traffic data to let users explore historic trends and find reports of outages happening on a given day.
- Airplane Crashes since 1970 till 2009 – The Dot (Point) map type, added in AnyMap 7.10.0, has the widest application range: showing cities, points of interest, events, creating density maps, etc. The JavaScript Dot map you see here shows airplane crashes all over the world (since 1970 till 2009) as dots on a map. The visualization is interactive: each dot is linked to a description of the crash in represents. Please note that in AnyMap dots on Dot maps are fully customizable – you can work with any of predefined marker types, code your own type, or use an image.
- Categories: AnyChart Charting Component, AnyMap, HTML5, JavaScript, News
- No Comments »
