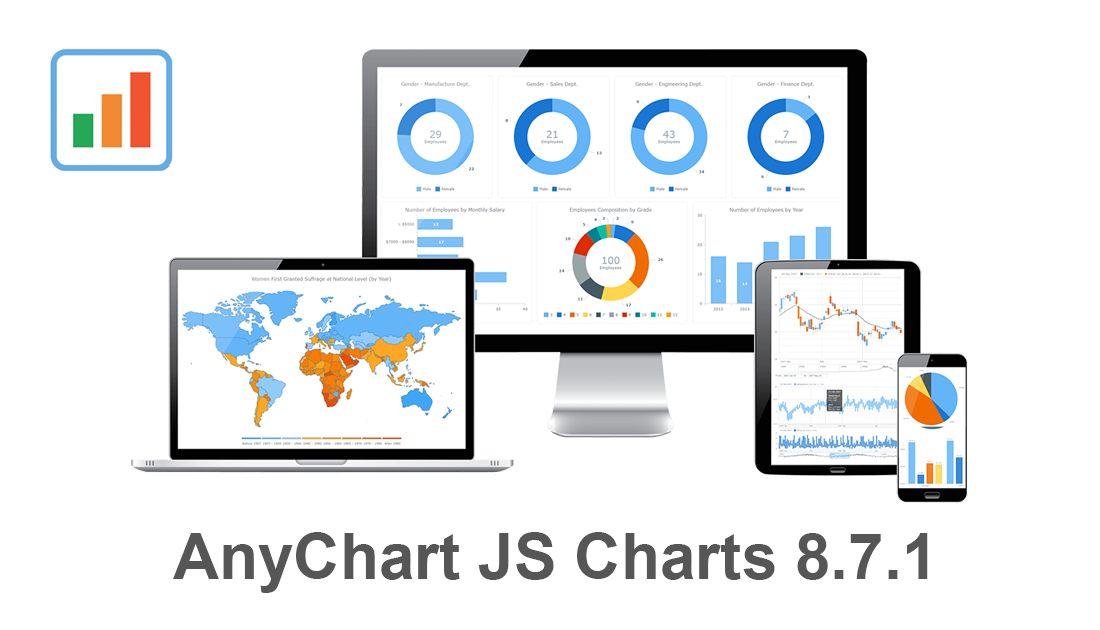
 Our JavaScript charting libraries are now updated! Just before the new year, we delivered important fixes and improvements to them in version 8.7.1. These updates make it even better to visualize data using our flexible visualization solutions for cross-platform HTML5 charting — AnyChart JS for basic charts, AnyGantt JS for project and resource charts, AnyStock JS for stock and any other time-series charts, and AnyMap JS for geographical and seat map charts.
Download version 8.7.1 now and start enjoying our updated JavaScript charting libraries!
Check the version history of the library you are using to see exactly what has been improved and fixed in the new release:
Let us know what else we should add or enhance. We’ve been always listening to you and your feedback has always largely determined our roadmap. Of course, this will remain so in the new year (and beyond). Any questions, give us a shout and we’ll be happy to assist you asap.
We wish you a happy and prosperous 2020!
- Categories: AnyChart Charting Component, AnyGantt, AnyMap, AnyStock, Big Data, Business Intelligence, Dashboards, Financial Charts, Gantt Chart, HTML5, JavaScript, News, Stock Charts
- No Comments »