All 3 Extensions for Qlik Sense Updated with New Charting Features in Version 3.4
June 19th, 2019 by AnyChart Team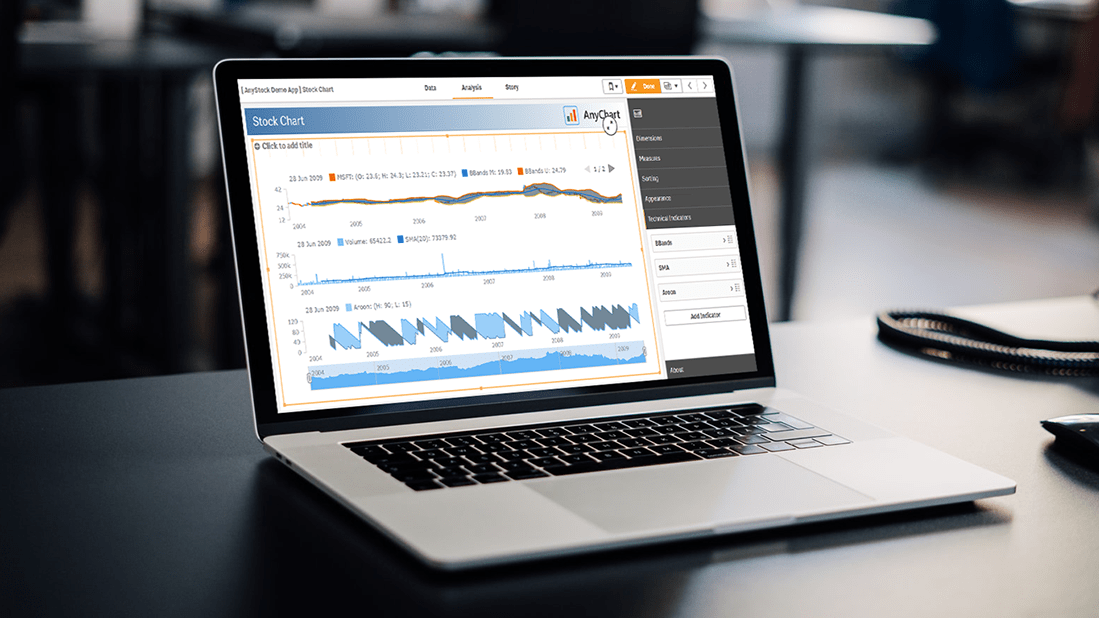 Hey Qlik users, we are happy to announce the release of version 3.4 for all our three extensions for Qlik Sense! We updated them with new awesome data visualization features and functionality such as technical indicators and more.
At last month’s Qlik Qonnections 2019 conference in Dallas where we exhibited as a new Qlik Technology Partner, we received amazing feedback from the Qlik community. We took that information and have already begun building out some of those requests for our next release of version 3.5 for our extensions for Qlik Sense, so please keep the feedback coming and we’ll keep building.
In the meantime here’s what we added.
Read more at qlik.anychart.com »
- Categories: AnyChart Charting Component, AnyGantt, AnyMap, AnyStock, Business Intelligence, Gantt Chart, Qlik, Stock Charts
- No Comments »
JS Charts Library AnyChart Adds Timeline Chart and Network Graph in Version 8.6.0
May 15th, 2019 by AnyChart Team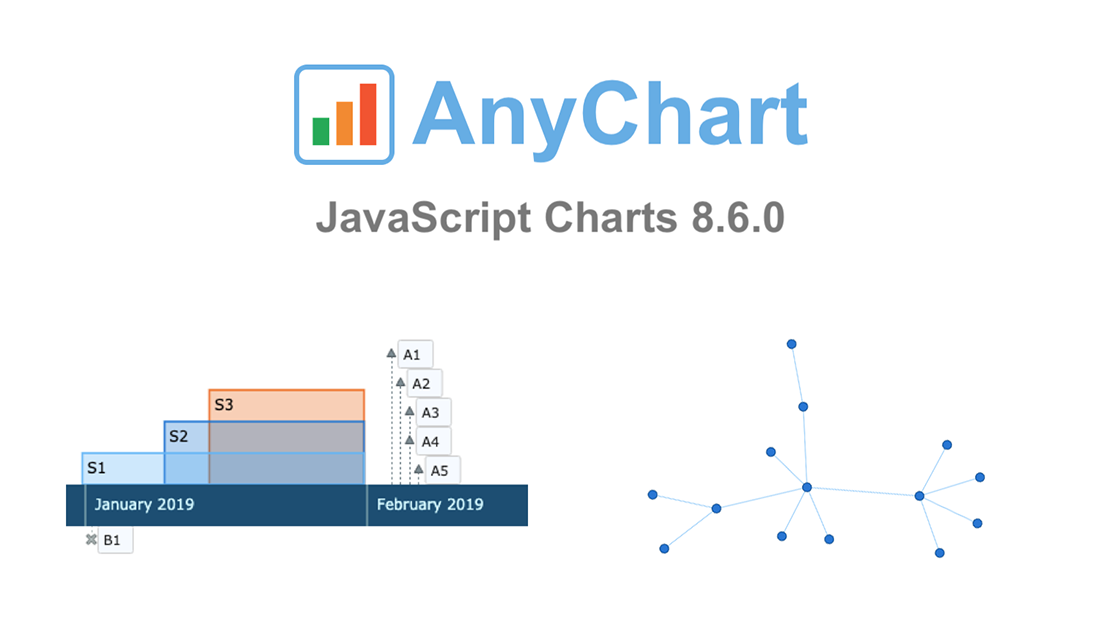 AnyChart 8.6.0 is out! Check out what new awesome interactive data visualization features we’ve added to our award-winning JS charts library!
First and foremost, two new chart types are now available out of the box — greet the main protagonists of the 8.6.0 release:
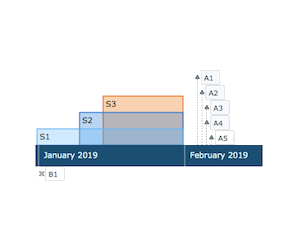 |
Timeline Chart in AnyChart JS Charts LibraryTimeline Chart is used to display a set of events in chronological order. It is typically a graphic design showing a long bar labeled with dates paralleling it, and usually contemporaneous events. Look at interactive Timeline Chart examples in our gallery. Read AnyChart Docs to learn how to create a JS Timeline Chart using our library. |
 |
Network Graph in AnyChart JS Charts LibraryNetwork Graph, also Graph Chart, is a mathematical structure (graph) designed to show relationships between data points. This chart type visualizes how entities are interconnected with each other. Entities are displayed as nodes (points). Relationship between them (edges) are depicted as lines. Check out interactive Network Graph examples in our gallery. Read AnyChart docs to learn how to create a JS Network Graph using our library. |
Then, the new major release AnyChart JS Charts 8.6.0 is bringing multiple other improvements, not to mention bug fixes.
Take a look into what’s new, by product:
Let us know if you have requests for new JS chart types or data visualization features. Contact our Support Team with all your tips and suggestions, and we’ll be happy to consider quickly delivering what you need. As always, you know.
Enjoy AnyChart 8.6.0!
- Categories: AnyChart Charting Component, AnyGantt, AnyMap, AnyStock, HTML5, JavaScript, News
- 1 Comment »
AnyChart Joins Qlik Technology Program and Adds 36 Chart Types to Qlik Sense in Just-Launched Extensions
May 7th, 2019 by AnyChart Team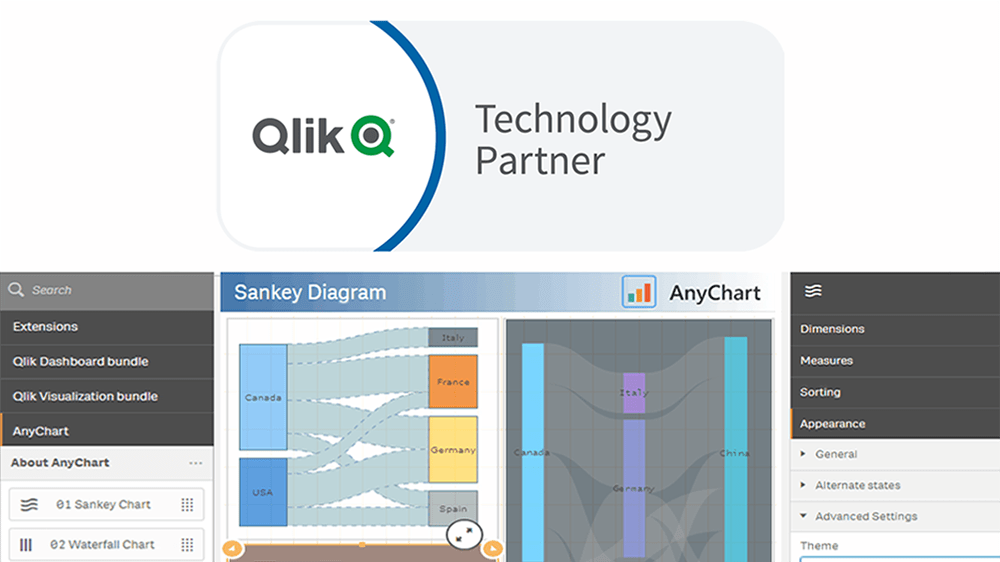
“We’re excited to be partnering with AnyChart, and their extensions will provide customers with additional choices for building even more compelling visualizations.”
— Mike Foster, Vice President, Strategic Partners at Qlik.
(Source: press release as of May 7, 2019.)
AnyChart crosses a new frontier! The vast data visualization capabilities of our award-winning JavaScript charting library, designed primarily for web developers and software engineers, are now available directly to data analysts and BI experts through powerful, flexible, intuitive extensions for Qlik Sense — AnyChart, AnyGantt, and AnyStock!
Read more at qlik.anychart.com »
- Categories: AnyChart Charting Component, AnyGantt, AnyStock, Big Data, Business Intelligence, Qlik
- 13 Comments »
JavaScript Data Visualization Libraries Updated with New Features — Meet AnyChart JS Charts 8.5.0
December 25th, 2018 by AnyChart Team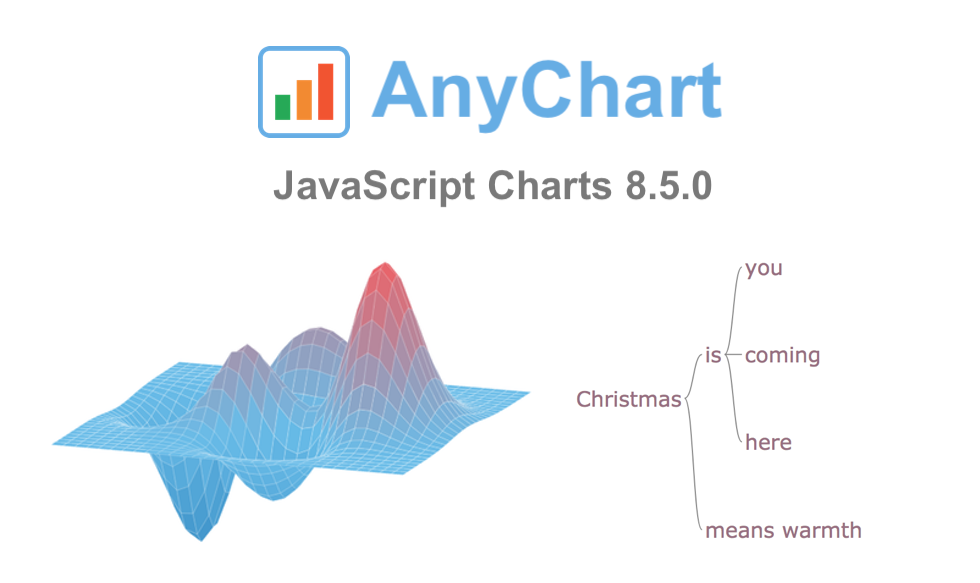 On this wonderful day, we are excited to announce a new major update for our JavaScript data visualization libraries: AnyChart 8.5.0 is released!
The new version brings a lot of advanced features and improvements that make our JS (HTML5) charting solutions even more powerful. 3D Surface Plot, Word Tree, and much more — spare a minute to look through the highlights of the 8.5.0 release of AnyChart, AnyStock, AnyGantt, and AnyMap.
- Categories: AnyChart Charting Component, AnyGantt, AnyMap, AnyStock, HTML5, JavaScript, News
- 1 Comment »
JS Sankey Diagram and Other Improvements in AnyChart 8.4.0 Released Just Now
October 8th, 2018 by AnyChart Team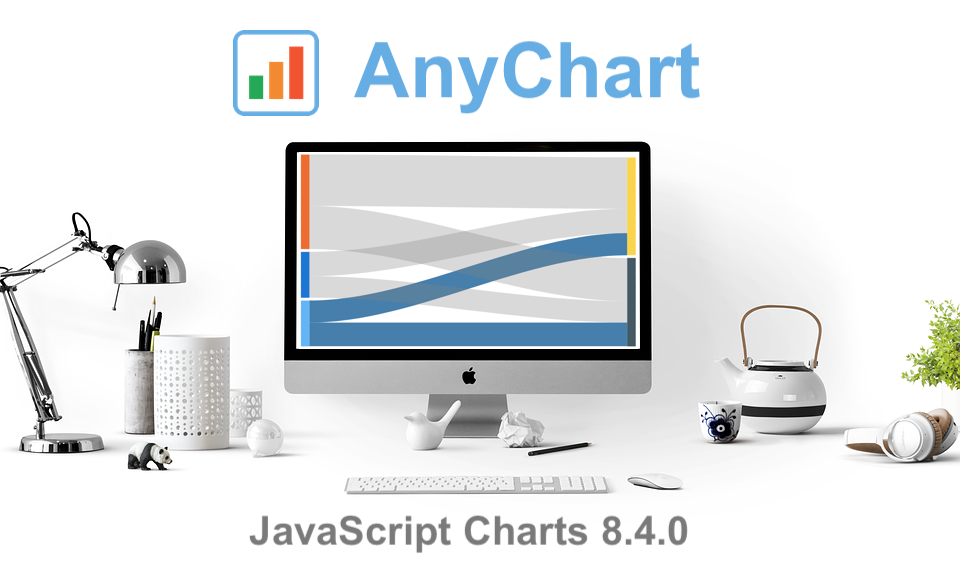 The year’s third major update for AnyChart is out, featuring the JS Sankey Diagram chart type as the ultimate centerpiece of the new release.
Learn more about AnyChart 8.4.0 and start making use of our updated JavaScript (HTML5) libraries for interactive data visualization right away.
- Categories: AnyChart Charting Component, AnyGantt, AnyMap, AnyStock, HTML5, JavaScript
- 1 Comment »
JS Chart Libraries Get New Great Features in 8.3.0 Release of AnyChart, AnyStock, AnyMap and AnyGantt
July 10th, 2018 by AnyChart Team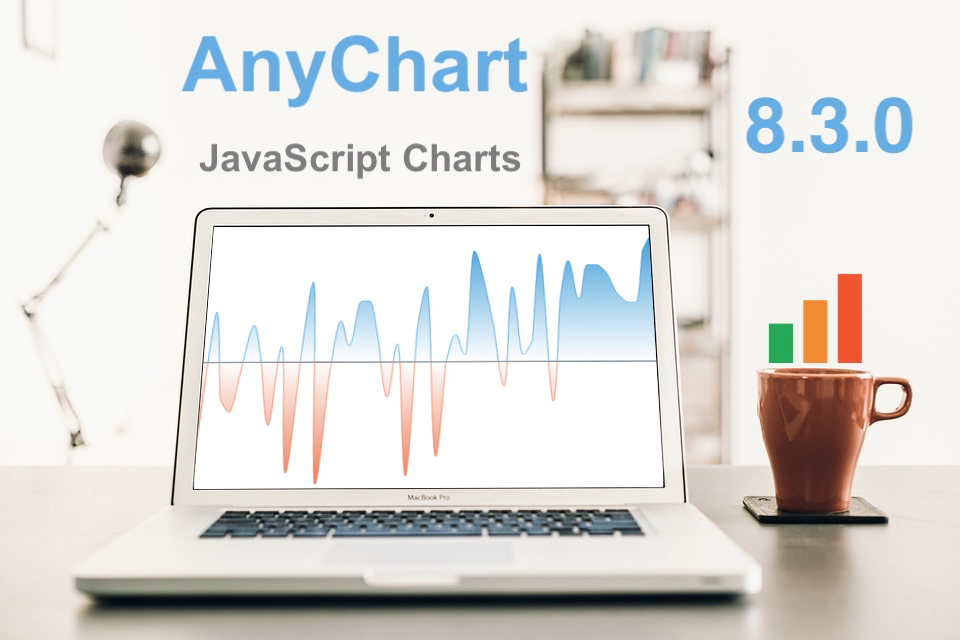 We at AnyChart are proud to announce the 8.3.0 release of our JS chart libraries AnyChart, AnyStock, AnyGantt, and AnyMap! The present major update brings full support of HTML in tooltips, background settings for chart data bounds, coloring rules and thresholds, easy axis label positioning, new technical indicators, and even more.
- Categories: AnyChart Charting Component, AnyGantt, AnyMap, AnyStock, Financial Charts, Gantt Chart, HTML5, JavaScript, News, Stock Charts
- 6 Comments »
JavaScript Chart Libraries AnyChart, AnyGantt, AnyStock and AnyMap Receive Major 8.2.0 Update
March 27th, 2018 by AnyChart Team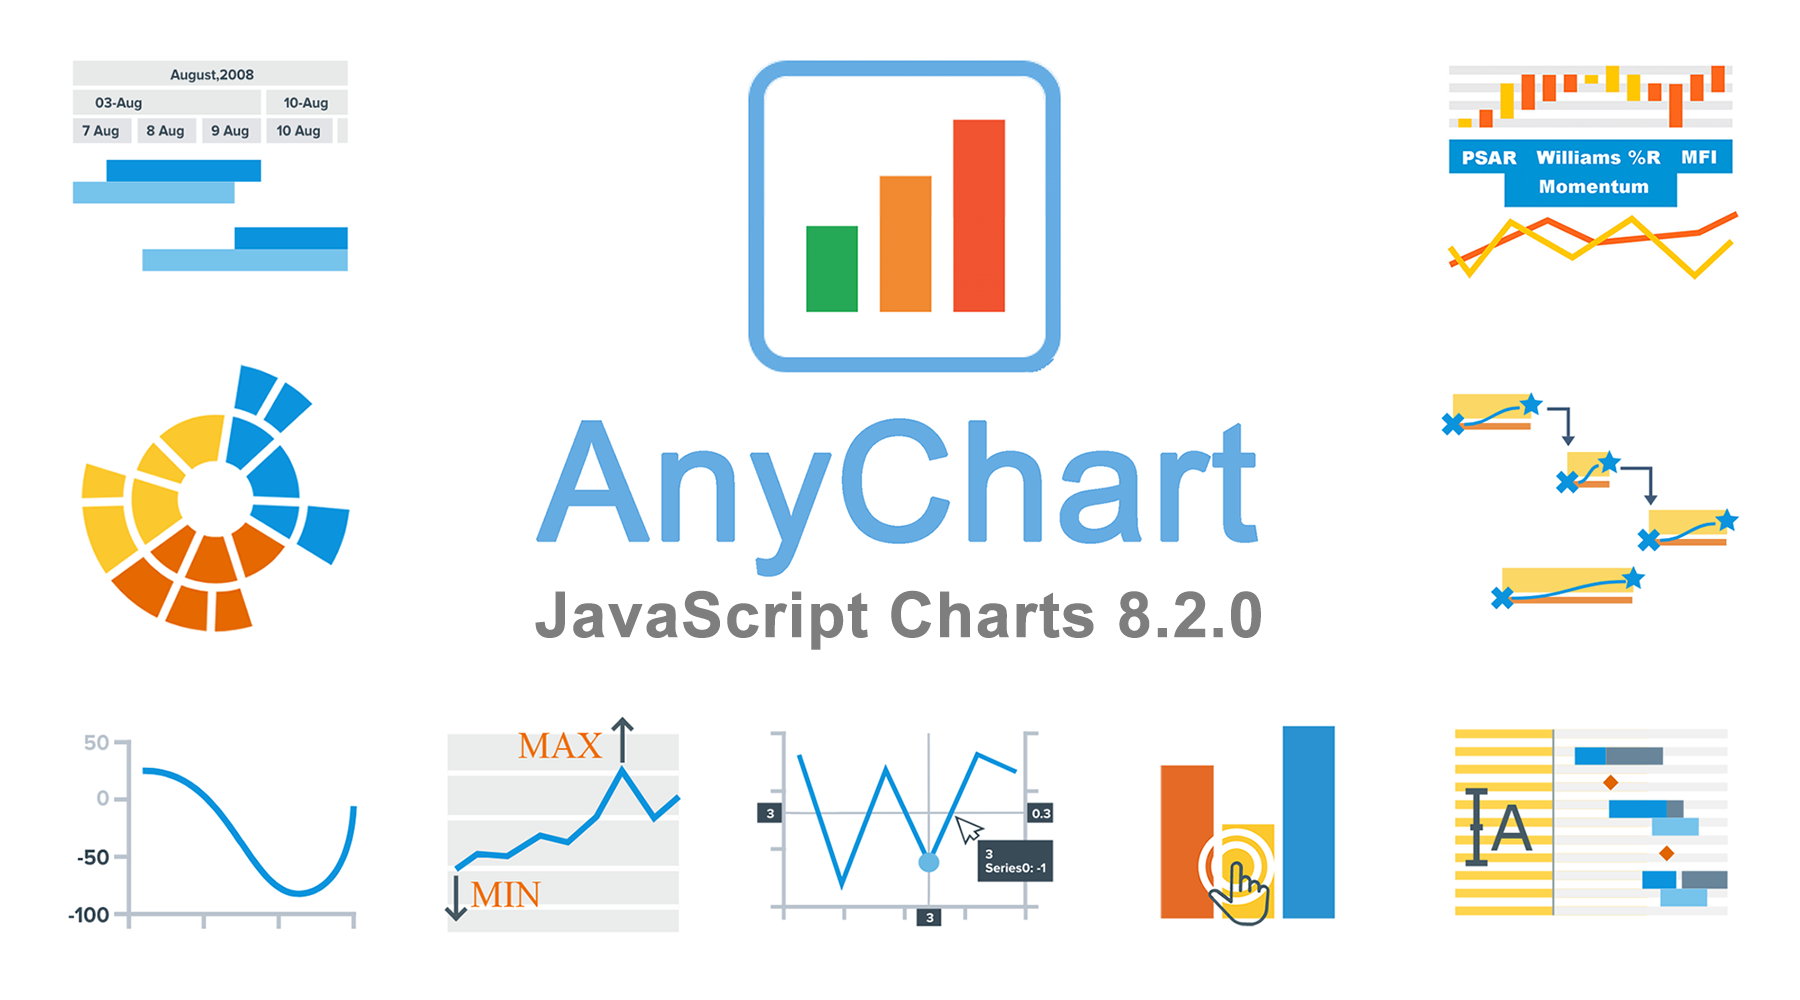 The time has come for another major update of our JavaScript chart libraries, recognized the best in JavaScript technologies earlier this year!
Meet version 8.2.0 of AnyChart, AnyStock, AnyGantt and AnyMap!
To start with, here’s a quick list of what major new cool features have been delivered to our interactive data visualization solutions with this new release:
- Sunburst Chart;
- negative logarithmic scale;
- crosshair multiple labels;
- minimum/maximum labels;
- new technical indicators and additional touch support in stock charts;
- custom drawing, data grid live editor, and new timeline in Gantt charts
Now, let’s take a closer look at each of the major news of AnyChart 8.2.0 and then see what’s next on our roadmap.
- Categories: AnyChart Charting Component, AnyGantt, AnyMap, AnyStock, Financial Charts, Gantt Chart, HTML5, JavaScript, News, Stock Charts
- 2 Comments »
Best JavaScript Technology: AnyChart JS Charts Library Wins 2018 DEVIES Award!
February 6th, 2018 by AnyChart Team It’s happened! Our AnyChart JS Charts library has just been officially named the best in JavaScript Technology for innovation and received a prestigious DEVIES award in California! (See all the 2018 DEVIES winners — one for each of the 15 categories.)
2018 DEVIES is reported to be the world’s leading DevTech Awards event, taking place these days during DeveloperWeek in Oakland, CA, the largest developer expo and conference series globally.
- Categories: AnyChart Charting Component, AnyGantt, AnyMap, AnyStock, HTML5, JavaScript, News, Qlik, Success Stories
- 6 Comments »
Happy New Year in JavaScript Charting: AnyChart 8.1.0 Is Out!
December 20th, 2017 by AnyChart Team The New Year and Christmas are already just around the corner, and we have something astonishing for you in this magical time! The next major update for our product family of JavaScript charting libraries is now released, so meet AnyChart 8.1.0!
Check out what new cool and useful features are delivered in the new versions of our HTML5-based interactive data visualization solutions AnyChart, AnyStock, AnyGantt and AnyMap, as well as what we are going to work on next.
- Categories: AnyChart Charting Component, AnyGantt, AnyMap, AnyStock, Financial Charts, Gantt Chart, HTML5, JavaScript, News, Qlik, Stock Charts
- 2 Comments »
Modular JavaScript Charting: AnyChart 8 Premiere
October 2nd, 2017 by AnyChart Team Fall is an amazing time for TV, movie, theater, and other art lovers as that’s when a lot of premieres are being launched. Well, we are happy to contribute to the debut mainstream this time! Meet AnyChart 8, a modular JavaScript charting system taking the convenience, performance, and customization in the art of interactive data visualization to the next level.
Join us in reviewing the core innovations delivered in the 8th, module-based generation of AnyChart, including the brand new features now available in our JS charting libraries AnyChart, AnyStock, AnyGantt, and AnyMap, as well as what else is in our nearest plans.
AnyChart JS Charts 8.0.0: Modules, Custom Builds, and Much More
The 8.0.0 release of the AnyChart, AnyGantt, AnyMap, and AnyStock JavaScript (HTML5) charting libraries delivers a lot of brand new features and technical improvements. Please see the list below for a quick overview of what’s new.
- Categories: AnyChart Charting Component, AnyGantt, AnyMap, AnyStock, Dashboards, Financial Charts, Gantt Chart, HTML5, JavaScript, News, Stock Charts
- 5 Comments »