AnyStock 1.7.0 Released
July 11th, 2012 by Margaret SkomorokhWe are proud to announce the release of AnyChart Stock and Financial Charts 1.7.0. We have made some significant changes and added a number of new features. Some of the improvements impact the default settings. Please take a moment to familiarize yourself with these changes prior to deploying.
The most important changes are in Fibonacci annotations settings and defaults: they have new defaults and are displayed in a new, different, and better way. Level labeling has been added and enabled by default. Fibonacci Fan now shows not only price levels but also time levels and a grid. If you upgrade to 1.7.0 and use Fibonacci annotations, you will see changes in your charts. However, you can revert to the old view by specifying additional settings in your configuration files.
Additionally, the <export> node is deprecated and replaced by the <export_settings> node, so it is strongly recommended to review your configuration files and make the necessary changes. In JSON configuration this replacement means: export turns into exportSettings. These changes are made to avoid problems with the objectModel chart property in Internet Explorer.
New features
- Fibonacci drawing tools have been significantly improved: you can tune the number and ratios of levels, add level labels, and so on. See:
- New positioning features for Event Markers: now you can place them below series and take into account series values. See Event Markers: Positioning for more.
- New Y Axes scale attributes: scale_start_ratio and scale_end_ratio. They provide a way to overlay charts in a nice way, and are particularly useful when one wants to display a Volume chart on the same plot with a Price chart. See Y Axes Settings: Limiting Scale Draw Region for more.
- New Y Axes scale attrbutes: soft_minimum and soft_maximum. They provide additional tuning options for scale auto calculation modes. See Y Axes Settings: Soft Minimum and Soft Maximum: Tuning Auto Calculation.
Improvements
- The <export> node is deprecated due to the problems it gave when trying to obtain the objectModel property in Internet Explorer. Please use the <export_settings> node instead.
- The logarithmic axis minimum auto calculation is improved.
Bug fixes
- The Scroller thumbnail series no longer displays missing values at the end of a data set as zeros.
- A separated tooltip pin no longer breaks when a zero length range is selected.
- Event markers are properly bound to series fields.
- Flex version no longer throws the errors which occasionally presented themselves while working with the component.
- Fibonacci Arcs geometry issues are fixed.
- Flex iOs mouse over problems are fixed.
- The enabled attribute of the <line> subnode of major and minor grids in axes now works properly.
Here you can see AnyStock version history: http://6.anychart.com/products/anystock7/history/
The new version is available for trial download: https://www.anychart.com/download/
- Categories: AnyStock
- No Comments »
AnyChart Stock 1.6.0 Released
December 26th, 2011 by Margaret SkomorokhToday we have released AnyChart Stock 1.6.0. This version includes the following changes:
New features
- The ability to specify Z-Index for series to define custom display order for regular series and technical indicators series. Read more about this feature at Series common settings: Z-Index.
- The ability to pin a certain value on a value scale to ensure its visibility. For more information, please see: Y-Axes Settings: Pinned Value.
Bug fixes
- Dashed line annotation slow rendering bug has been fixed.
- The fieldType property in the object model is no longer ignored after calling the applySettingsChanges method.
Version history: http://6.anychart.com/products/anystock7/history/
Trial download: https://www.anychart.com/download/
- Categories: AnyStock
- No Comments »
Signatrol Ltd Chooses AnyStock for spYdaq Online Data Logging Solution
December 12th, 2011 by Margaret SkomorokhWe are proud that our components are succesully used in a wide variety of industries. The success story we are presenting today is about Signatrol Ltd – a company that has been supplying data loggers since 1994. Their products are used in various areas: warehousing, transportation, food preparation, building management, environmental monitoring of offices, schools, museums.
Signatrol created a low cost wireless monitoring solution — spYdaq. It is a system comprising of a number of radio transmitting sensors that measure parameters (temperature, humidity, voltage, etc.) and send them securely by using a license free radio network to a central Basestation. The system has an ability to store information on the dedicated website. And to visualise the data, AnyChart Stock and Financial Charts component was chosen.
The challenge was:
- To make an online visualization of data obtained from a number of different sensors over long periods of time.
- To provide comfortable navigation through complex graphs.
- To integrate graphs into PHP sourced pages, with data obtained from MySQL databases.
AnyStock was used because:
- It allows for visualizing large sets of time-based data by creating fast and easy updatable charts.
- AnyStock supports advanced interactivity and navigation options. Navigation through data is also facilitated by custom text labels and a smart legend.
- Due to simple XML interface, AnyStock is compatible with different kinds of web technologies and database management systems, including PHP and MySQL.
You can enjoy the full success story here:
| Signatrol Signatrol Ltd Chooses AnyStock for spYdaq Online Data Logging Solution >> |
Other stories can be found here: https://www.anychart.com/company/success_stories.php
- Categories: AnyStock, Success Stories
- No Comments »
AnyStock 1.5.1 Available
October 30th, 2011 by Margaret SkomorokhAnyStock 1.5.1 update is available for download at our site. It includes some significant changes:
Bug fixes
- IMPORTANT: Formatting rules now enforce escaping comma when it is used as a decimal or thousand separator. In the previous version you could use something like that: {%Value}{decimalSeparator:,} although documentation states that comma should be escaped by back slash. Since 1.5.1 rules are strict, and only the following expression works correctly: {%Value}{decimalSeparator:,}.
If you are upgrading from previous versions, you should check your configs and change them so that they followed the comma escaping rule.
- Formatting in value highlighter now works correctly.
- addEventMarker method now works correctly with localeBasedDate.
- Scroller events are now fired in the correct order when unselected area is clicked.
- Null values are now correctly treated as nulls (not zeros).
- MFI indicator now reads the period parameter correctly.
Improvements
- onAnnotationRemove event now returns not only the ID of a removed annotation, but also this annotation as an object — a useful improvement for implementing an “Undo” feature.
- Full compatibility with Flex 4.5 Mobile SDK — you can use AnyStock SWC in your iOs or Android Flex projects.
- Range preset buttons behavior improved, particularly when you sync two different chart objects at one page.
Documentation updates
- Updating Event Markers Visual Settings Using JavaScript sample from Online HTML/JavaScript Samples Center has been fixed.
- onAnnotationRemove description was updated in JavaScript API Reference and AnyChart Stock Flex Component: API Reference.
Version history: http://6.anychart.com/products/anystock7/history/
Trial download: https://www.anychart.com/download/
- Categories: AnyStock
- No Comments »
AnyStock 1.5.0 Released
August 22nd, 2011 by Margaret SkomorokhWe have released an update of AnyChart Stock and Financial Charts, AnyStock 1.5.0, with the following changes:
New features
- The ability to set different left and right timescale margins in pixels has been added. Read more at: Timescale Right and left paddings.
- We have added a new parameter in the applySettingsChanges() method: preserveSelectedRange, which allows to preserve selected range when chart settings are modified.
Bug fixes
- The bug in the version 1.4.0 that lead to incorrect placement of event markers is fixed.
So if you work with AnyStock 1.4.0 and use the event markers feature, you have to update to the version 1.5.0.
Documentation updates
- Basic and Advanced Samples for AnyStock Flex have been added. See AnyChart Stock Flex Component: Your First Chart and AnyStock Flex Stock Portal.
Download AnyStock 1.5.0: https://www.anychart.com/download/
Version history: http://6.anychart.com/products/anystock7/history/
- Categories: AnyStock
- No Comments »
AnyStock 1.3.0 Available
July 1st, 2011 by Margaret SkomorokhToday, AnyChart Stock and Financial Charts 1.3.0 is available. In the new version, several important improvements have been made:
New technical indicators
New features
- Ability to bind Y-Axis markers to series values to display chart data on the axis. Read more about this feature in User’s Guide article: Y-Axis Markers: Binding to series values.
- Ability to get data set content using the getDataSetCSV() method. You can see how it works in the following example: Online HTML/JS Sample Center: Exporting CSV data.
- A new method getCurrentYAxisInfo() that allows getting scale minimum, maximum and interval values when they are calculated automatically.
Bug fixes
- Grouping of data provider fields with “High” and “Low” approximation types was incorrect.
- Volume+MA indicator worked improperly with ma_period attribute. This error has been fixed.
Download AnyStock 1.3.0: https://www.anychart.com/download/
Version history: http://6.anychart.com/products/anystock7/history/
Roadmap: http://6.anychart.com/products/anystock7/roadmap/
- Categories: AnyStock
- No Comments »
AnyStock 1.2.0 Available
June 2nd, 2011 by Timothy Loginov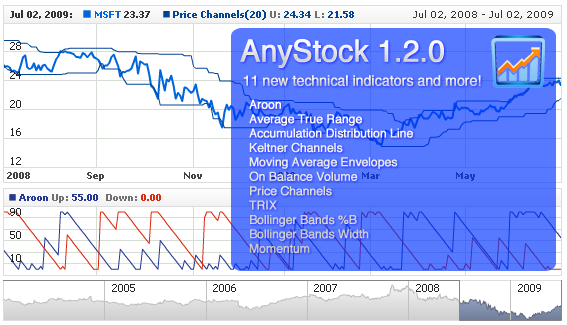
Today we have released a new version of AnyChart Stock and Financial Charts – 1.2.0.
The following new features are available:
- It is now possible to set a time offset in hours for annotation anchor points in the same way it is done for data points or event marker anchors.
- Two new events have been added that allow tracking the beginning and the end of editing annotations.
- Eleven new technical indicators have been added: Aroon, Average True Range (ATR), Accumulation Distribution Line (ADL), Keltner Channels, Moving Average Envelopes (MA Envelopes), On Balance Volume (OBV), Price Channels, TRIX, Bollinger Bands %B, Bollinger Bands Width, Momentum.
Bug fixes:
- The SWC library showed a wrong info in the VERSION constant. This bug has been fixed.
- The error reporting system now works correctly when errors in defining timestamps formats for data sets or data providers are encountered.
Demos and Help Materials updates:
- onAnnotationEditingStart() and onAnnotationEditingFinish() sample handlers have been added.
- The description of new technical indicators has been added.
Full version changes information: http://6.anychart.com/products/anystock7/history/
The roadmap for the next version: http://6.anychart.com/products/anystock7/roadmap/
Download the latest version: https://www.anychart.com/download/
- Categories: AnyStock
- No Comments »
AnyStock 1.1.1 Released
May 17th, 2011 by Timothy LoginovA new version of AnyChart Stock and Financial Charts is available – AnyStock 1.1.1.
In this version, a new navigation feature has been added: users can now quickly select a particular area of a plot by holding the SHIFT key and moving a mouse, the video below illustrates this feature (and you can do it yourself on any AnyStock chart):
There is also an update of our help materials: a new sample has been added to Online HTML/JS Samples Center: Synchronizing Selected ranges in Two Different Chart Objects.
Two bugs have been fixed. Firstly, when allow_edit attribute forbids editing annotations, the points beneath them are now highlighted correctly. Secondly, using the applySettingsChanges() method no longer makes annotations invisible, and doesn’t prevent from adding new annotations.
Here is the roadmap for future versions of AnyStock: http://6.anychart.com/products/anystock7/roadmap/
- Categories: AnyStock
- No Comments »
UNAVCO Chooses AnyStock to Visualize Geodetic Data
May 12th, 2011 by Margaret SkomorokhAnyChart Stock and Financial Charts is a powerful tool for visualizing any time-based data, not only financial one. For example, AnyStock can perfectly deal with the results of geoscience surveys, which include gathering and analyzing large amounts of data, both real-time and historical.
The success story we are publishing today is about UNAVCO – a non-profit consortium that is dedicated to geoscience research and education using geodesy. UNAVCO collects, stores and makes available to the research community terabytes of geodetic and related time-series data. Much of this data originates from the Plate Boundary Observatory which is a network of over 1,100 permanent GPS stations located in the western U.S., Alaska, Canada and Baja California. These stations measure the slow deformation of the earth’s crust to sub-centimeter accuracy.
The challenge was:
- To plot real-time GPS positions generated by over 300 stations in the PBO network for display on our website.
- To provide researchers time-series plots of hourly meteorological data, collected by station instruments, for the purpose of evaluating environmental factors influencing GPS signals.
- To provide end users the ability of scaling and scrolling time-series plots on-the-fly.
AnyChart Stock and Financial Charts was chosen, being an instrument with full feature set for creating real-time streaming (new data is added without reloading plots). AnyStock also provides rich format, pan and zoom options for easy navigation, which allows working with long term and large data sets.
You can enjoy the success story here:
| UNAVCO UNAVCO Chooses AnyStock to Visualize Geodetic Data >> |
Other stories can be found here: https://www.anychart.com/company/success_stories.php
- Categories: AnyStock, Success Stories
- No Comments »
HeadHunter Chooses AnyStock to Visualize hh.index
April 29th, 2011 by Margaret SkomorokhToday we publish a new success story: HeadHunter have chosen AnyStock to visualise hh.index.
HeadHunter, founded in 2000, is a leading Russian Internet recruitment company. Its main asset is the hh.ru site, with a base of 120 thousand job offers and 5.5 million CVs. Companies invite through this site 140 thousand candidates weekly. HeadHunter is a part of Mail.Ru Group – a major Russian Internet company, leading in the number of monthly unique visitors in Russian Internet segment, the owner of ICQ instant messaging service and many other IT companies.
The challenge was to visualize hh.index — the balance between the number of resumes and the number of vacancies submitted at the site for a particular period of time, which is an important index of business and economical activity and requires quality tools. It was needed that chart could be customized on-the-fly.
AnyChart Stock and Financial Charts were chosen, being an excellent tool for visualizing time-based data. It allows creating fully customizable interactive charts, displaying long term data sets in a comprehensible form.
You can enjoy the success story here:
| HeadHunter HeadHunter Chooses AnyStock to Visualize hh.index >> |
Other stories can be found here: https://www.anychart.com/company/success_stories.php
- Categories: AnyStock, Success Stories
- No Comments »