Visualizing Information on Coronavirus, MiLB Teams, and Providence Buildings — DataViz Weekly
February 19th, 2021 by AnyChart Team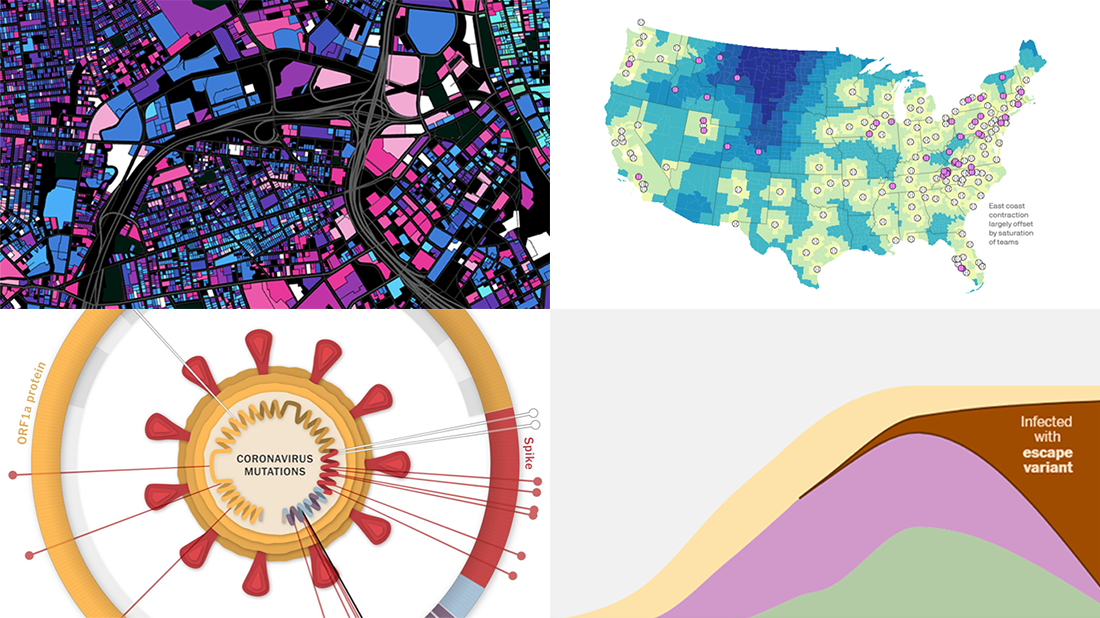 For us humans, data is usually easier to explore and analyze when it’s properly visualized. If you are looking for some good examples, you’ve come to the right place at the right time! DataViz Weekly is here to let you know about new great information visualizations.
Today on DataViz Weekly:
- Coronavirus vaccination pace, goals, and challenge — The Washington Post
- Coronavirus mutations and variants — The New York Times
- Distance to the nearest MiLB team in 2021 — Axios
- Age of buildings in Providence, RI — Chris Sarli
- Categories: Data Visualization Weekly
- 1 Comment »
Interesting Data Visualization Projects to Look at and Learn from — DataViz Weekly
February 12th, 2021 by AnyChart Team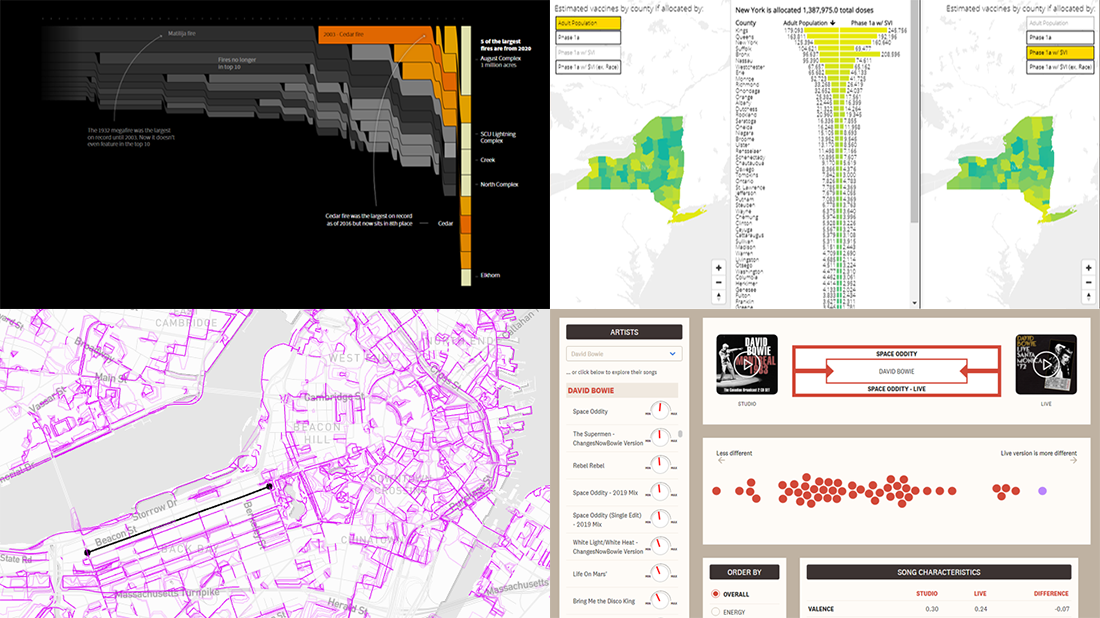 “Numbers have an important story to tell. They rely on you to give them a clear and convincing voice,” Stephen Few once said. That actually is the purpose of data visualization. On DataViz Weekly, we show you how this works in reality. Welcome to our new roundup of the most interesting data visualization projects we’ve recently found!
- Comparing live and studio versions of songs — The Pudding
- Historical wildfires in the U.S. West — Reuters
- Boston’s most desirable streets — MIT Senseable City Lab
- Inequality and COVID-19 vaccine allocation in America — GHJP Yale & C4SR Columbia
- Categories: Data Visualization Weekly
- No Comments »
Four New Awesome Data Visualization Examples for Inspiration — DataViz Weekly
February 5th, 2021 by AnyChart Team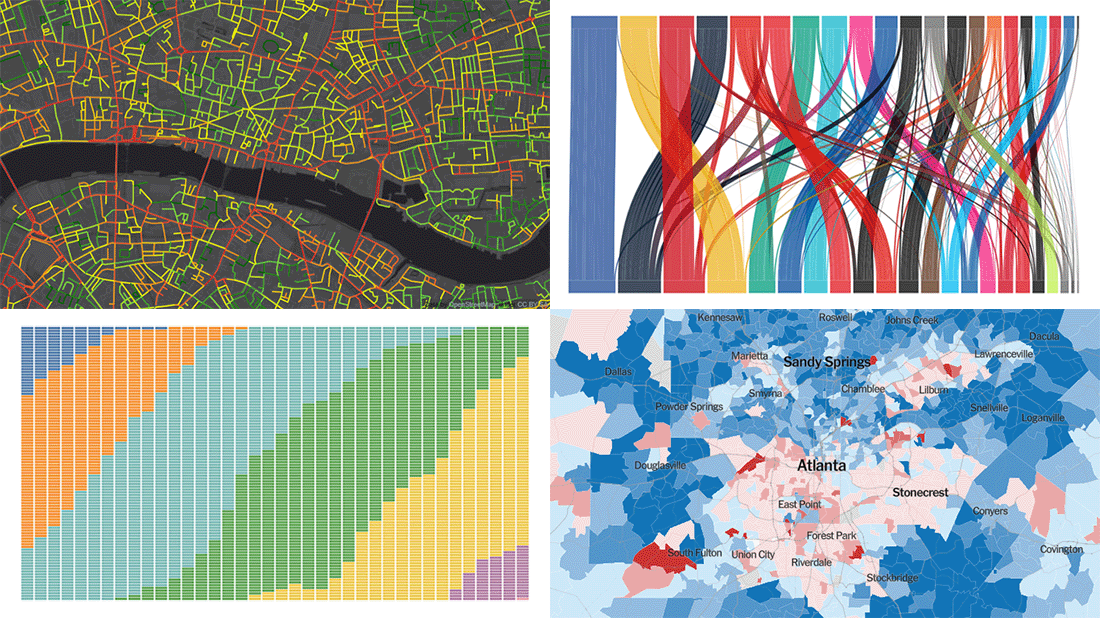 Data visualization is our passion and we are glad to high-five all who share it! Welcome to DataViz Weekly! For all of you guys, we have curated another four new awesome interactive data visualization projects worth checking out. Glance at their list below and then take a closer look:
- WorldTour transfers during the 2020-2021 offseason — Carrie Bennette
- Precinct-level map of the 2020 U.S. election — The Upshot
- Representation of age generations in the U.S. Senate over time — wcd.fyi
- Healthy Streets Index for London — _STREETS
- Categories: Data Visualization Weekly
- No Comments »
New Stunning Charts and Maps from Around the Web — DataViz Weekly
January 29th, 2021 by AnyChart Team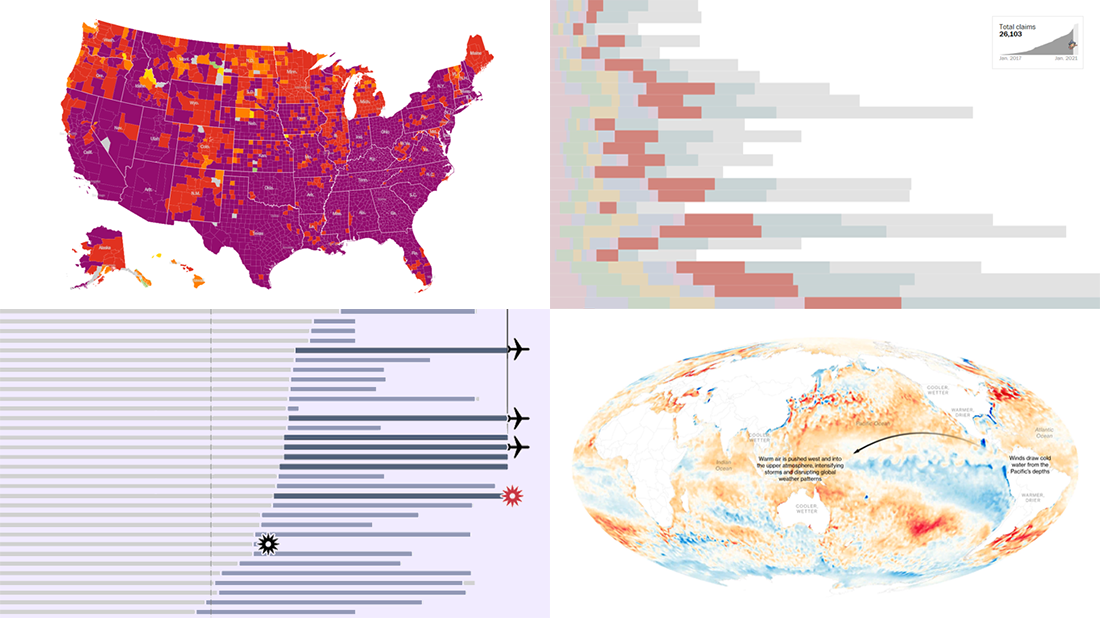 We continue our weekly blog feature where we show you the best data visualizations we’ve met out there over the past seven days. Here’s our new selection of stunning charts and maps from different creators — check it out! Today on DataViz Weekly:
- La Niña and its impacts — Bloomberg
- Donald Trump’s false and misleading claims while in office — The Washington Post
- COVID-19 risk levels by county — The New York Times
- Sriwijaya Air fleet — Reuters
- Categories: Data Visualization Weekly
- No Comments »
Great Visualizations Not to Miss — DataViz Weekly
January 22nd, 2021 by AnyChart Team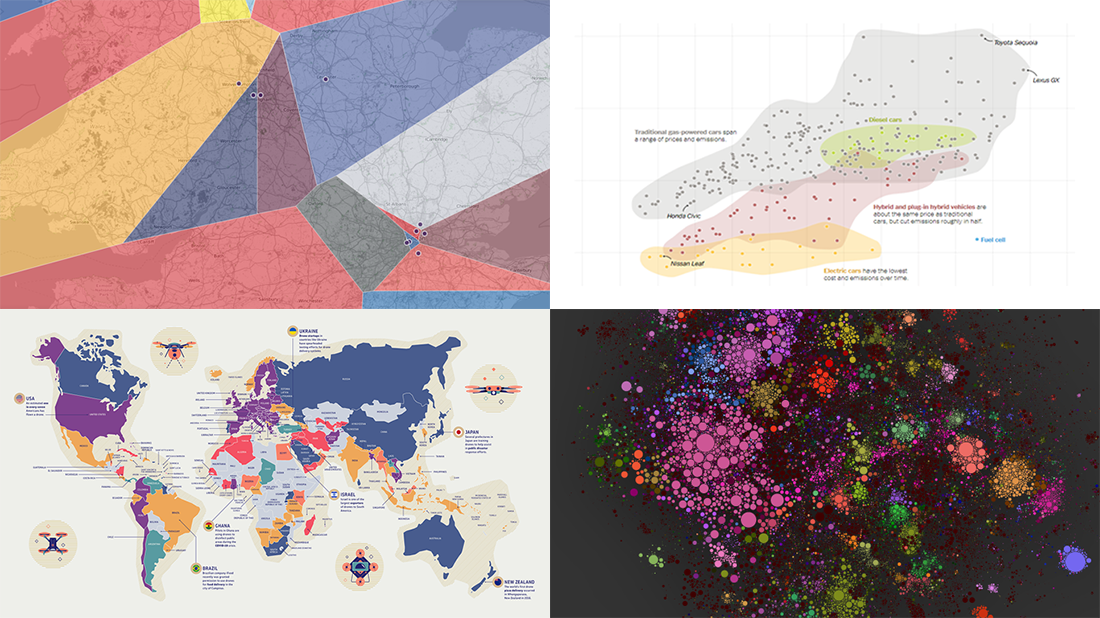 For those unfamiliar with DataViz Weekly, each Friday we select the most interesting data visualization projects from all we’ve discovered these days around the internet. Then we present them in a dedicated summary post. Look at our new picks!
- Electric, hybrid, and gas car costs vs emissions — NYT
- Nearest English football team — Automatic Knowledge
- Map of 100,000 books — David Manzanares
- Drone privacy legislation worldwide — Surfshark
- Categories: Data Visualization Weekly
- No Comments »
New Compelling Data Visualizations on Climate Change — DataViz Weekly
January 15th, 2021 by AnyChart Team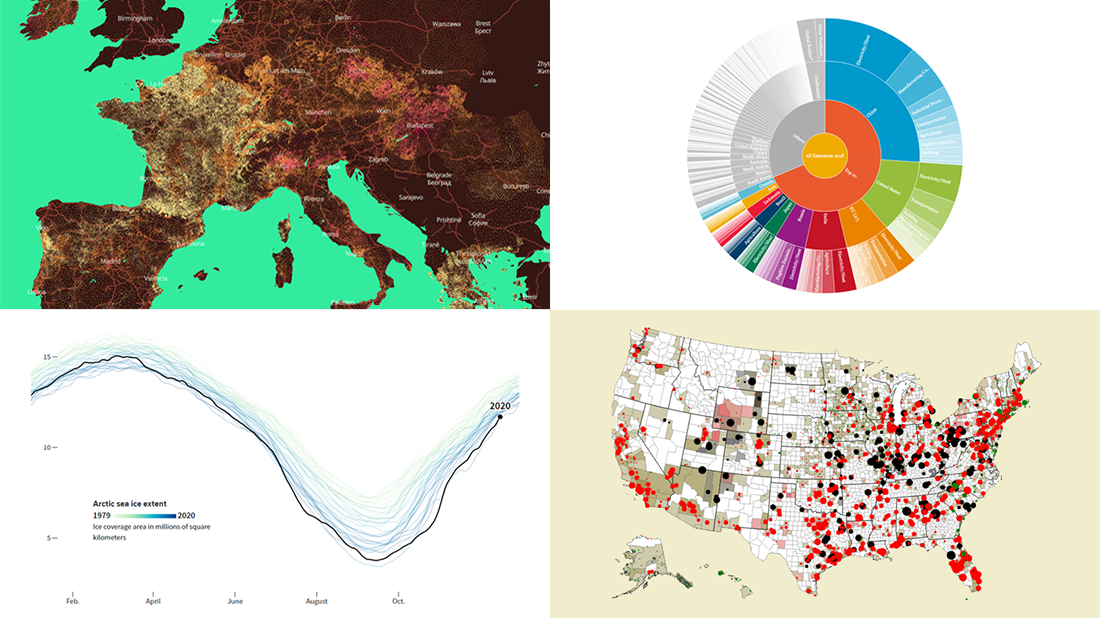 Lately, we’ve come across a number of compelling new data visualizations on climate change and related topics. And we’ll tell you about some of the most interesting ones right now! Check out the new DataViz Weekly roundup.
- Fingerprints of climate change in 2020 — Reuters
- Global warming in European municipalities — EDJNet
- Top greenhouse gas emitters — WRI
- Future of U.S. fossil fuel-fired electricity — Emily Grubert
- Categories: Data Visualization Weekly
- No Comments »
Best Data Visualizations of 2020 — DataViz Weekly
January 8th, 2021 by AnyChart Team Each week throughout the 2020 year, we curated the most interesting data visualizations from around the Web and introduced them to you in the DataViz Weekly roundup. Now is the time to look at the best of the best! We will hand you over to distinguished experts — Nathan Yau, Alli Torban, Lea Pica, Kenneth Field, and the GIJN team — who have already made their (brilliant) choices. Meet their picks for the best data visualizations of 2020!
- Categories: Data Visualization Weekly
- 1 Comment »
2020 Year in Review in Charts — DataViz Weekly
January 1st, 2021 by AnyChart Team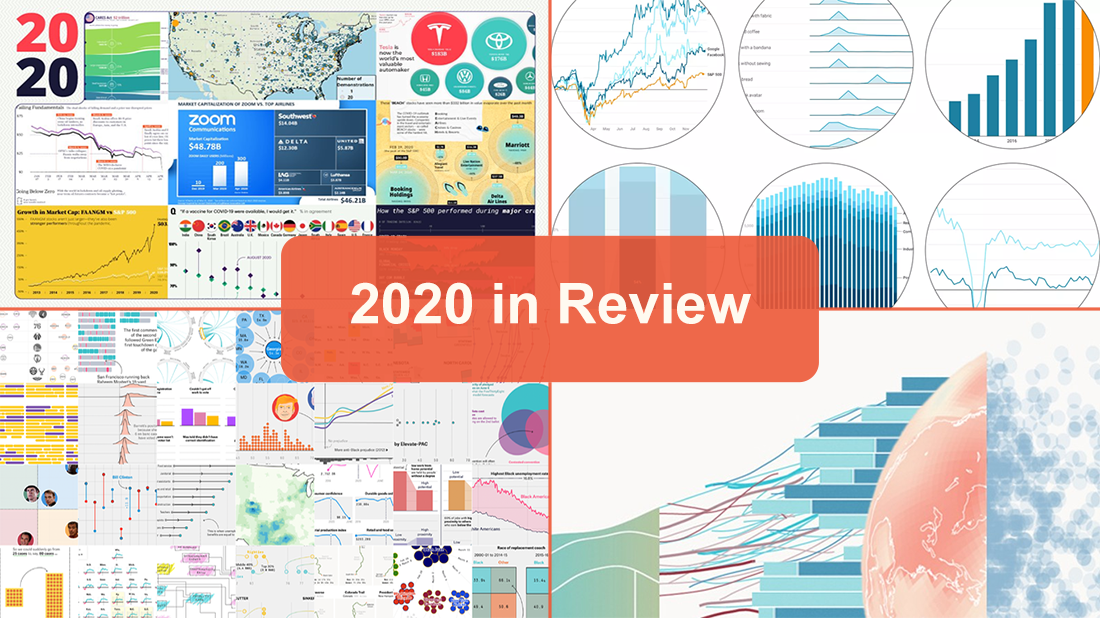 2020 was strange. It was difficult. But it was. Happy New Year everyone! 🎉
Even though 2020 was not that bad in everything, we all hope, of course, that 2021 will be (much) better. Let it be so! But before we dive into the new one, let’s take a glance back and remember 2020 as is, with the help of great data visualizations.
The January 1st issue of DataViz Weekly invites you to look through the lists of the charts included in the year-in-review features on Visual Capitalist, Recode by Vox, FiveThirtyEight, and The Economist. Sneak a peek, and then check out the graphics.
- Categories: Data Visualization Weekly
- 1 Comment »
Latest Best Data Visualizations Worth Checking Out — DataViz Weekly
December 25th, 2020 by AnyChart Team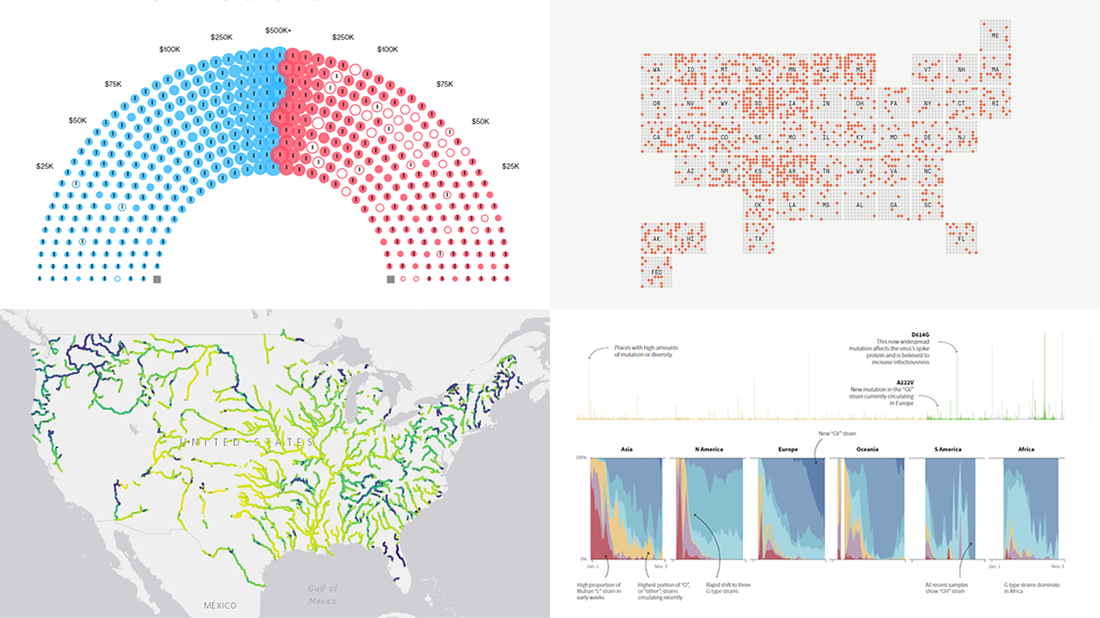 Merry Christmas everyone (who’s celebrating)! 🎄 Meanwhile: COVID, election, and environment — the topics quite symbolic for this year are in the spotlight of today’s, the year’s last DataViz Weekly. Don’t miss out on some of the latest best data visualizations!
Look at the list of projects featured on DataViz Weekly this time and keep reading to learn more about each:
- Winners of the 2020 U.S. election by funding from Wall Street — Bloomberg
- COVID-19 infection rates in prisons by state — The Marshall Project
- Novel coronavirus strains in evolution worldwide — Reuters
- River colors across the United States — Gardner Hydrology Lab at Pitt
- Categories: Data Visualization Weekly
- 1 Comment »
New Graphics That Make Data Talk — DataViz Weekly
December 18th, 2020 by AnyChart Team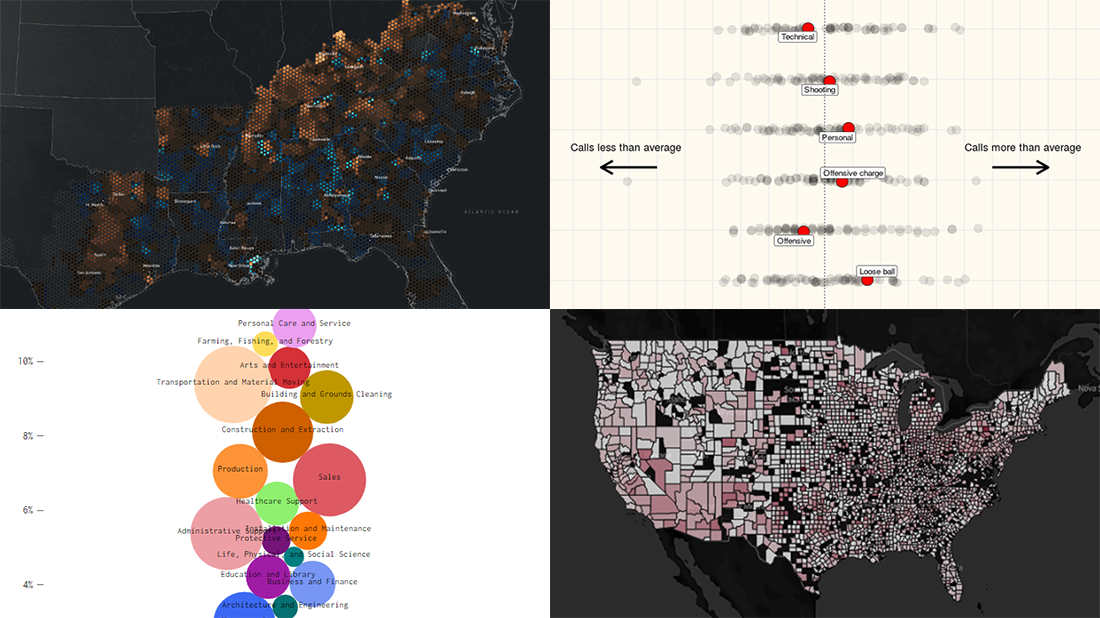 Get ready for another dose of amazing charts and maps! DataViz Weekly‘s here to show you a set of new projects featuring graphics that make data talk — excellent examples of data visualization in action!
Here are this week’s picks:
- Over 200 years of migrations in the American South — Edward Ayers, Nathaniel Ayers & Justin Madron
- NBA fouls and violations, by referee — Owen Phillips
- U.S. unemployment change, by occupation — Nathan Yau
- U.S. hospital COVID-19 bed occupancy — Carlson School of Management at UMN
- Categories: Data Visualization Weekly
- No Comments »