How to Create JavaScript Word Cloud Chart — Tutorial for Web Developers
April 30th, 2019 by Irina Maximova
Wondering how to make a beautiful interactive Word Cloud using JS? Then you’re in the right place! In this data visualization tutorial, I’ll guide you through the entire development process, demonstrating it’s easier to create a JavaScript word cloud chart for an HTML5 app or web page than you might think!
Also known as tag clouds, word clouds represent a popular visual technique designed to reveal how often tags (or basically, any words) are mentioned in a given text body. Essentially, the word cloud chart type leverages diverse colors and sizes to display at a glance different levels of relative prominence.
Now that we’ve got an idea of what a word cloud is, let’s get down to learning how to quickly code one using JavaScript!
Read the JS charting tutorial »
- Categories: AnyChart Charting Component, HTML5, JavaScript, JavaScript Chart Tutorials, Tips and Tricks
- 8 Comments »
How to Create Stunning Interactive Bar Charts Using JavaScript — Tutorial
April 3rd, 2019 by Alfrick Opidi Web developer Alfrick Opidi shows how to create beautiful interactive bar charts using JavaScript (HTML5), taking the AnyChart JS charting library as an example along the tutorial.
Read the JS charting tutorial »
- Categories: AnyChart Charting Component, Charts and Art, HTML5, JavaScript, JavaScript Chart Tutorials, Tips and Tricks
- No Comments »
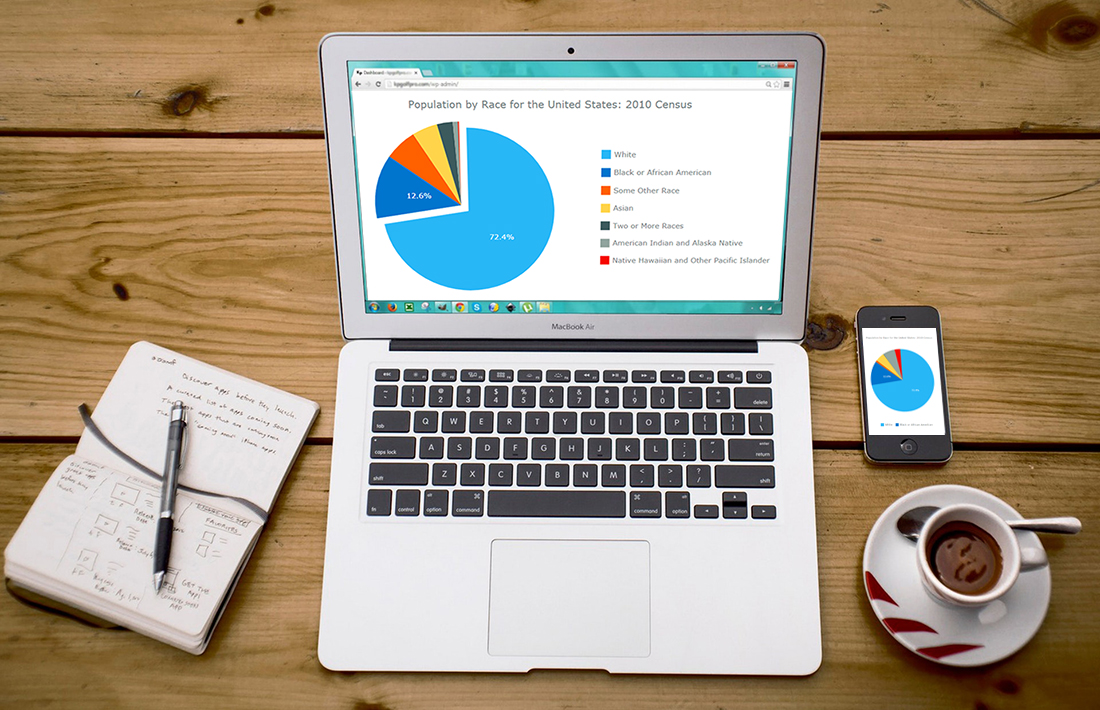
How to Create Pie Chart with JavaScript
December 6th, 2017 by Timothy Loginov Have you ever wondered, how web developers create and integrate interactive JavaScript pie charts into HTML5 apps and web pages? If the answer is yes – keep on reading! This article explains how to create, change and integrate a pie chart into your web page. Beware! A hot-button political issue is present in this article. But we will not offend anyone!
Pie chart is one of the most popular chart types. Mathematically speaking it looks like a circle divided into sectors which represent a part of a whole. For the most of us, pie charts look like real pies or pizzas cut into several slices. In this article, you will find a detailed tutorial on how to build one, with JS chart code samples.
Read the JS charting tutorial »
- Categories: AnyChart Charting Component, HTML5, JavaScript, JavaScript Chart Tutorials, Tips and Tricks
- 29 Comments »
How to Create JavaScript Area Chart
October 28th, 2017 by Timothy Loginov Want to know how to build a JavaScript area chart? This article will show you how to do that and tell you who invented area charts in the late 18th century.
The area chart is one of the basic charts used to show changes in data over time. The key feature of this chart type is a colored area between the horizontal X-axis and the line marking the changing value. It can be filled with a color, gradient color, or with a hatch fill.
Look at the chart on the title image. That’s the data visualization being created along the tutorial. Such a JavaScript-based area chart will be interactive and good-looking in any browser, on any website and in any app in HTML5. All samples used in the article are available in our collection on CodePen.
Read the JS charting tutorial »
- Categories: AnyChart Charting Component, HTML5, JavaScript, JavaScript Chart Tutorials, Tips and Tricks
- 3 Comments »
Creating JavaScript Bar Chart
October 25th, 2017 by Timothy Loginov How to create a JavaScript bar chart and why is this important? Every day, data visualization becomes all the more powerful and important area of the Web. The volume of information grows, and it must be made understandable as fast as possible. That’s when data visualization instruments like charts and dashboards become a great help.
Creating HTML5 charts might seem a complicated task, but this assumption is wrong. This article blows this prejudice to pieces and shows how to build an interactive bar chart using JavaScript.
The result will look like on the picture above. Then you’ll also learn how to quickly modify and customize such a JavaScript (HTML5) bar chart. All the JS chart examples used along the tutorial can be found on CodePen.
Read the JS charting tutorial »
- Categories: AnyChart Charting Component, HTML5, JavaScript, JavaScript Chart Tutorials, Tips and Tricks
- 15 Comments »