AnyStock Alpha Preview
August 3rd, 2015 by Margaret Skomorokh
AnyChart Stock 7 is an upcoming addition to new AnyChart 7 HTML5 JavaScript Engine: Financial charting solution that allows to turn your real time data into highly sophisticated charts with interactive capability.
Designed to display large datetime datasets, AnyStock is the ideal tool for client reporting and performance based reporting applications. Reports and Dashboards are visualized with scrolling, drill downs, panning and zoom functionality.
Demo page: https://www.anychart.com/products/anystock/demos/alpha/
What you can see on a demo page is the early Alpha preview of AnyStock, this chart shows dataset of 20.000 points and it usually takes about half a second to be rendered in a modern browser on an average workstation. The title of the chart you see shows results of the real performance benchmark for this chart on your computer.
We are working hard to go into the release stage, polishing all bells and whistles and hoping to make it by September 2015.
New AnyStock will feature amazing speed and all the neat things our customers loved previous versions of in AnyStock, and it will be fully integrated into the new AnyChart 7 Framework and share most of its ideology, settings technique and ease of use – and you will be able to use it along other charts, including those we have in the AnyChart Basic Charts, AnyGantt Gantt Charts and AnyMap HTML5 Maps.
We are convinced that you will be pleased with the result, stay tuned!
- Categories: AnyStock, HTML5, JavaScript, News
- 2 Comments »
AnyChart 7.5.1 Available – new version of our HTML5 charts
July 8th, 2015 by Margaret SkomorokhAnyChart 7.5.1, a bug fix release of our HTML5 charts, is now available. This version contains the following changes:
Improvements
- Improved the Animation feature.
Bug fixes
- Fixed the bug with multiple markers in Circular Gauges.
- Solved the issue with the min/max bubble size in Bubble Charts.
- Fixed the bug with Inside Labels incorrect overlapping in Pie Charts.
We are sorry for any inconveniences caused by the bugs. Our team is constantly working to improve AnyChart and achieve the best quality possible. And you’re always welcome to submit any questions to our support system.
AnyChart version history: https://www.anychart.com/products/anychart/history/
Trial download: https://www.anychart.com/download/
- Categories: AnyChart Charting Component, HTML5, JavaScript, News
- 1 Comment »
Sparks & Associates Chooses AnyChart to Visualize Assessment Results using JavaScript pie chart
July 3rd, 2015 by Margaret SkomorokhToday we are glad to publish a new customer success story – about AnyChart and Sparks & Associates.
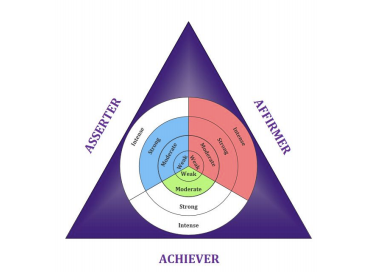
 The Actualized Leadership Profile (ALP) is a 77-item self assessment that measures an individual’s dominant motive need and corresponding style of leadership. Based on the seminal works of Abraham Maslow and David McClelland, the ALP measures the degree of self-actualization that is demonstrated in one’s current style of leadership. A customized, full color and confidential report identifies the strengths and limitations in the individual’s current leadership approach.
The challenge was:
- To provide a creative and intuitive visualization of personal assessment results.
- To create a visualization that accepts result parameters from the system’s existing ASP code.
Solution:
- AnyChart JavaScript (HTML5) component was chosen as a solution. The flexibility of the AnyChart.graphics technology allowed to nest several pie charts and create a multi-level JavaScript pie chart not available from other chart vendors.
- AnyChart provides the flexibility to use customized background visualizations.
You can enjoy the full success story here:
|
Sparks & Associates Sparks & Associates Chooses AnyChart to Visualize Assessment Results >> |
Or see other AnyChart Customer Success Stories.
- Categories: AnyChart Charting Component, HTML5, JavaScript, News, Success Stories
- No Comments »
Top 5 Books about Data Visualization and Charting
June 30th, 2015 by Anton BaranchukEvery day at AnyChart we deal with a lot of different data visualizations, charts, diagrams, dashboards when we help our clients to build their beautiful products. So, we have a lot of experience with both Flash and HTML5 charts, but also we recognize power of reading to get theoretical understanding of basic concept from guru-thinkers. Here are our top 5 picks: Read more »
- Categories: AnyChart Charting Component, Books, Business Intelligence, Dashboards, HTML5, JavaScript, Tufte
- No Comments »
AnyChart 7.5.0 and AnyGantt 7.5.0 Released – new version of our HTML5 charts
June 18th, 2015 by Margaret SkomorokhGood news! Today we have two major releases of our HTML5 charts for our customers: AnyChart 7.5.0 and AnyGantt 7.5.0. In the new versions of our components, you will find the Funnel and Pyramid chart types, Dashbording Tools, the Printing and Animation options, and other significant improvements. Check them out:
AnyChart 7.5.0 New Features
 |
Dashboarding Tools The purpose of Dashboarding Tools is to provide simple and convenient instruments for building complex Dashboards. In the current release we present the first part of this set: the ability to highlight/hide series and points, using special methods. See API Reference for more details >> |
 |
Printing The new printing method allows you to make a full-page print of a chart or a dashboard. It supports eight paper size formats: US Letter, A0 – A6, and the portrait/landscape switch. Read more about Printing >> |
 |
Animation Most popular charts types – Line, Column, Bar, Area, and so on – are now animated. Animation supports duration settings and start&finish events. Take a look at the Gallery samples >> |
 |
Funnel Charts Funnel charts (also called accumulation charts) show percentage ratio. They are often used to represent different stages in sales process and show the amount of potential revenue for each stage. Read more about Funnel Charts >> Take a look at the Gallery samples >> |
 |
Pyramid Charts Pyramid charts are used to visualize the hierarchical structure of topics, and progressively ordered quantitative data. Read more about Pyramid Charts >> Take a look at the Gallery samples >> |
AnyGantt 7.5.0 New Features
 |
Printing The new printing method allows you to make a full-page print of your chart. It supports eight paper size formats: US Letter, A0 – A6, and the portrait/landscape switch. Read more about Printing >> |
 |
Events Events allow to handle such user actions as rowClick, rowMouseOver, rowMouseMove, etc. with the .listen() and .listenOnce() methods. Using this methods, you can override default chart interactivity. |
 |
XML/JSON/CSV Data Support The XML and JSON formats can be used for data and settings input; CSV can be used for data input. XML and JSON schemas are available. Learn how you can work with data >> |
 |
Summary Tasks Auto-Calculation The actualStart, actualEnd, and progressValue data fields of grouping tasks became optional. If they are missing, auto-calculation is done, based on tasks in the group. Take a look at the Gallery sample >> |
AnyChart version history: https://www.anychart.com/products/anychart/history/
AnyGantt version history: https://www.anychart.com/products/anygantt/history/
Trial download: https://www.anychart.com/download/
- Categories: AnyChart Charting Component, AnyGantt, Dashboards, Gantt Chart, HTML5, JavaScript, News
- No Comments »
DeviceLock Chooses AnyChart HTML5 charts for Its DLP Security Solution
June 11th, 2015 by Margaret SkomorokhWe are happy to announce that a new customer success story has been added to our site.
 DeviceLock, Inc, established in 1996, is a leading provider of endpoint device/port control and data leak prevention software for business, education and government institutions around the world. The company offers DeviceLock, a policy-based endpoint data leak prevention (DLP) security solution that enables network administrators to centrally control uploading and downloading activity through local computer devices and network protocols and applications.
The challenge was:
- To present the activity of DeviceLock in a clear and visually appealing way.
- To make complex data easy to read and understand so that the situation could be quickly evaluated by the end user.
Solution:
- AnyChart JavaScript charts were chosen as a solution. The component allows to create stylish interactive HTML5 charts and provides excellent rendering performance.
- Due to wide variety of chart types and the flexibility of AnyChart, it was possible to implement user-friendly data visualizations.
You can enjoy the full success story here:
|
DeviceLock DeviceLock Chooses AnyChart for Its DLP Security Solution >> |
Or see other AnyChart Customer Success Stories.
- Categories: AnyChart Charting Component, Business Intelligence, HTML5, JavaScript, Success Stories
- No Comments »