Heading to Qlik Connect 2025 — Join Us There!
February 25th, 2025 by AnyChart Team We are going to Qlik Connect 2025! 🚀
Not packing just yet — May is still a bit away. But we are getting ready and looking forward to meeting the amazing Qlik community in Orlando, with lots of great presentations and conversations ahead.
We will be there with our Qlik Sense extensions, bringing something special to push the boundaries of visual analytics in Qlik even further. Make sure to stop by if you are around — we would love to connect!
And while we are counting down the days, feel free to check out how great it was last year — take a moment to revisit our Qlik Connect 2024 recap.
See you in Orlando! 📍
- Categories: Big Data, Business Intelligence, Dashboards, News, Qlik
- No Comments »
20+ Years of Advancing Data Visualization: Interview with Our CEO
February 5th, 2025 by AnyChart Team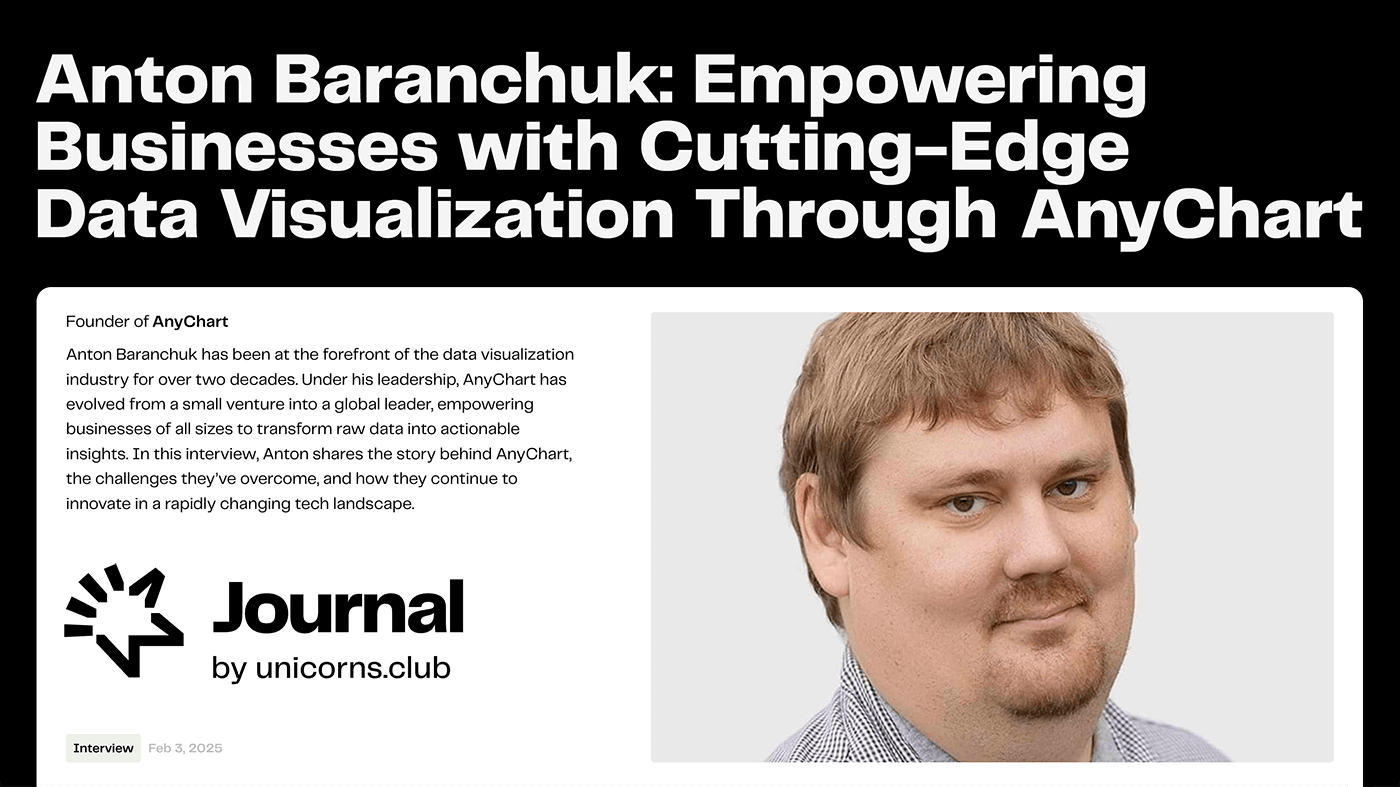 Unicorns Journal just published an interview with our CEO and co-founder, Anton Baranchuk, where he reflects on AnyChart’s journey from a small startup to a global leader in data visualization, trusted by enterprises worldwide.
Anton talks about how we got started, the transition from Flash to JavaScript charting, our work with Qlik, and the vision and values that continue to drive us forward.
- Categories: AnyChart Charting Component, AnyGantt, AnyMap, AnyStock, Big Data, Blogroll, Books, Business Intelligence, Dashboards, Financial Charts, Flash Platform, Gantt Chart, GraphicsJS, HTML5, JavaScript, News, Oracle Apex, Qlik, Stock Charts, Success Stories
- No Comments »
Reflecting on 2024 and Embracing 2025 — Happy New Year!
January 9th, 2025 by AnyChart Team Another remarkable year is officially in the books! Here at AnyChart, 2024 was a truly rewarding journey marked by innovation and impact:
- Named Best Tech in Data Analytics & Visualization — once again!
- Enhanced our JavaScript charting library with exciting new features and tweaks, particularly in Timeline, Waterfall, and Circle Packing charts — plus multiple custom solutions tailored to your specific needs.
- Thrived in the Qlik ecosystem with transformative updates for our extensions for Qlik Sense, rocking Qlik Connect in Orlando, and more — explore our 2024 highlights as Qlik’s Technology Partner.
As we step into 2025, we remain committed to pushing the boundaries of data visualization and analytics, ensuring you always have the tools you need to excel and succeed. Here’s to an even greater year ahead — happy 2025, and stay tuned for what’s coming next!
- Categories: AnyChart Charting Component, AnyGantt, AnyMap, AnyStock, Big Data, Blogroll, Business Intelligence, Charts and Art, Dashboards, Financial Charts, Gantt Chart, HTML5, JavaScript, News, Qlik, Stock Charts
- No Comments »
Introducing AI Splits for Instant Root Cause Insights in Qlik Sense
October 31st, 2024 by AnyChart Team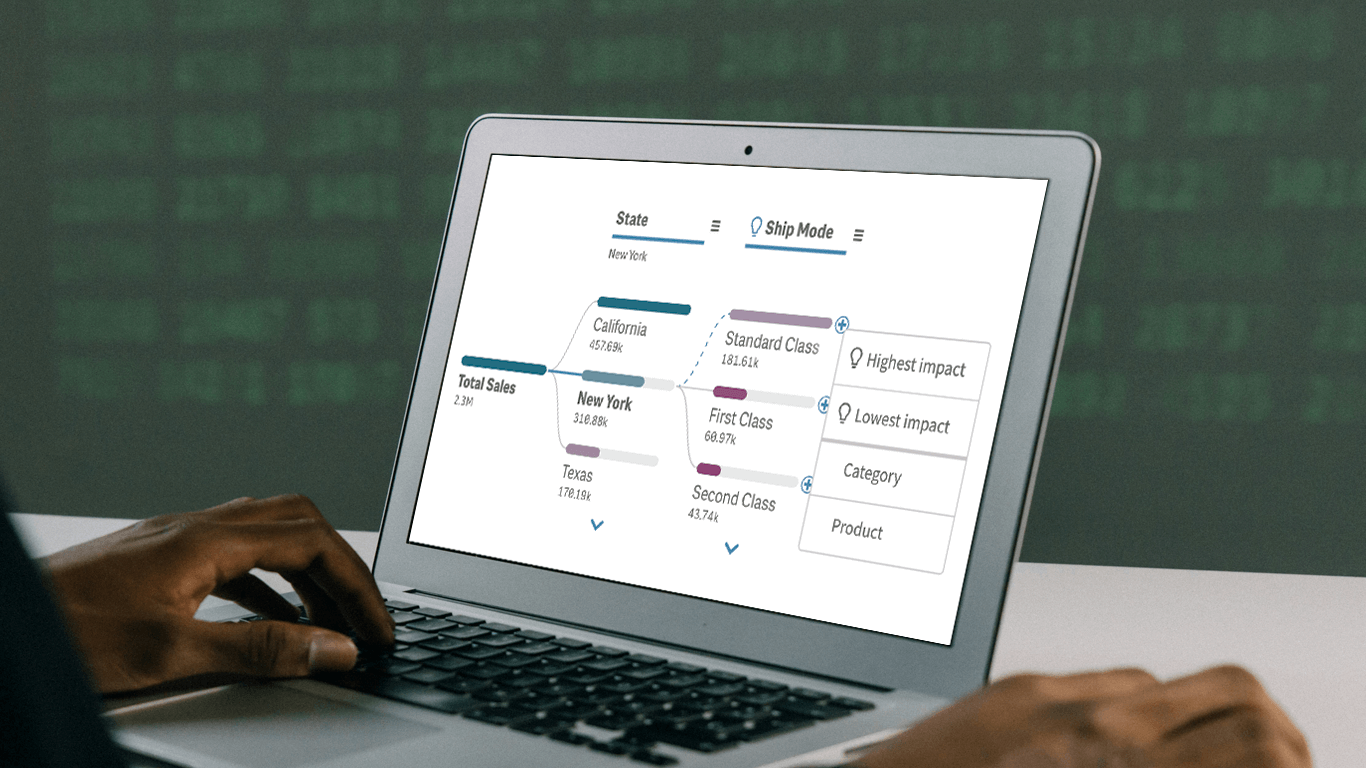 In today’s fast-paced business environment, rapidly understanding the underlying factors within vast amounts of data is crucial for informed decision-making. The Decomposition Tree in Qlik Sense excels at breaking down complex datasets to reveal the “why” behind the numbers. Now, with the game-changing AI Splits feature, this visual becomes even more powerful, automatically highlighting critical impacts and elevating root cause analysis to new heights.
Let’s explore what makes AI Splits transformative and how to implement it.
Read more at qlik.anychart.com »
- Categories: Big Data, Business Intelligence, News, Qlik
- No Comments »
New AI & Visualization Features for Data Analysis in Qlik Sense
October 31st, 2024 by AnyChart Team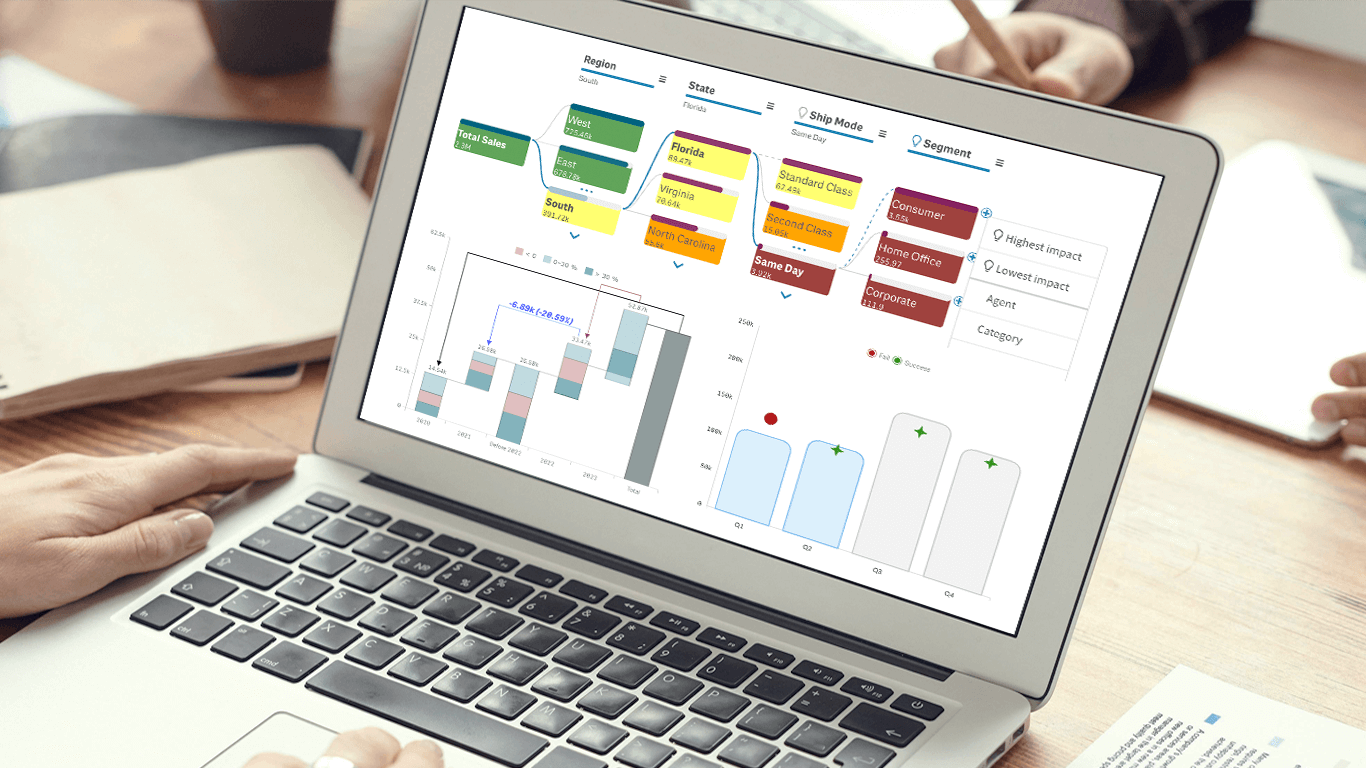 We’re excited to announce a series of updates to our extensions for Qlik Sense! They bring greater flexibility and precision to your data visualizations, allowing for uncovering deeper insights even more effectively. The most stunning new feature is AI Splits in the Decomposition Tree — let your users find the highest and lowest impacts with unprecedented speed!
Read on to learn what’s new at qlik.anychart.com »
- Categories: Big Data, Business Intelligence, News, Qlik
- No Comments »
Introducing AnyChart 8.13.0 for Elevated JavaScript Charting Experience
October 3rd, 2024 by AnyChart Team AnyChart 8.13.0 is now available, bringing a set of new features and improvements designed to further elevate your data visualization experience. In this release, we’ve focused on enhancing the Timeline, Waterfall, and Circle Packing charts in our JavaScript charting library, making them even more flexible and user-friendly. Read on to explore what’s new!
- Categories: AnyChart Charting Component, AnyGantt, AnyMap, AnyStock, Big Data, Business Intelligence, Dashboards, Financial Charts, Gantt Chart, HTML5, JavaScript, News, Stock Charts
- No Comments »
Celebrating Success at Qlik Connect: Recap from AnyChart
July 10th, 2024 by AnyChart Team Qlik Connect 2024 was nothing short of amazing, not just for its vibrant atmosphere but also for the palpable successes we experienced. Beyond the buzz, we showcased our latest advancements for Qlik Sense, gathered a wealth of insights, made meaningful contacts, and ran a hit interactive game that became the talk of the event. We even clinched a win in the social media contest — an unplanned but welcome accolade indeed! Join us for a recap of our time at Qlik Connect in Orlando.
Read more at qlik.anychart.com »
- Categories: Big Data, Business Intelligence, Dashboards, News, Qlik, Success Stories
- No Comments »
Let’s Connect at Qlik Connect 2024: AnyChart Booth #807
May 13th, 2024 by AnyChart Team Qlik Connect 2024 is on the horizon, and we’re pleased to announce that AnyChart will be participating as an Emerald sponsor and exhibitor. Join us from June 3–5 at Rosen Shingle Creek in Orlando, Booth #807!
Read more at qlik.anychart.com »
- Categories: AnyChart Charting Component, Business Intelligence, Dashboards, Gantt Chart, News, Qlik
- No Comments »
Free Qlik Webinar: Qlik Sense Revolution — One Sheet Is Enough
March 6th, 2024 by AnyChart Team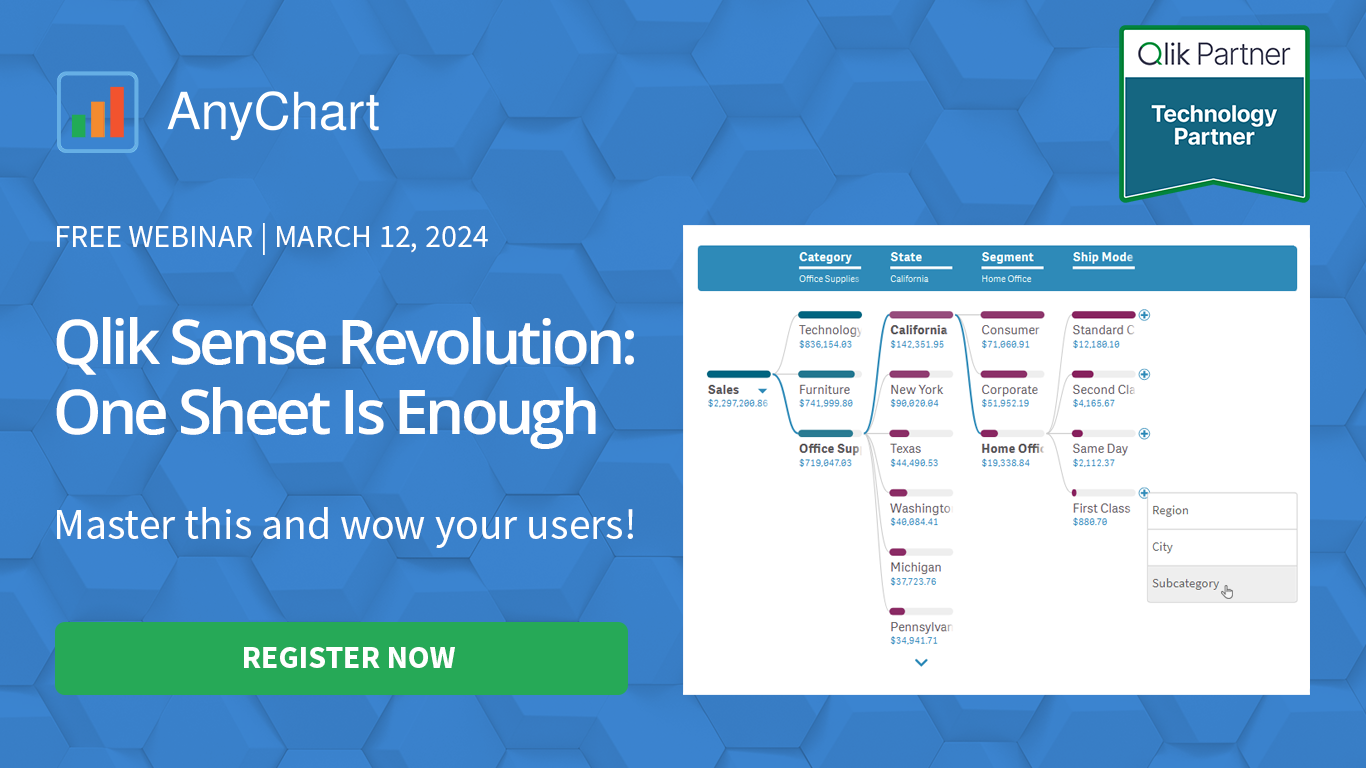 Hey Qlikkies! Still burying insights under layers of charts and sheets? It’s time to break free from wrestling with complex datasets and win the hearts of your business users!
Join our exclusive webinar and meet the Decomposition Tree — a new powerhouse visualization that’s taken Power BI by storm and now graces Qlik Sense. This game-changer slices through data complexity, offering root cause analysis on a single sheet. Drilling down into the heart of any value with superhero speed has never been easier! No more juggling overcomplicated visuals — just instant insights, effortlessly.
- Categories: Big Data, Business Intelligence, News, Qlik
- No Comments »
AnyChart Triumphs Again: Awarded Best in Data Analytics and Visualization in 2024
February 19th, 2024 by AnyChart Team We are delighted to announce that AnyChart has won the prestigious 2024 DEVIES Awards in the Data Analytics & Visualization category, marking our victory for the second consecutive year!
The award celebrates our JavaScript charting library, continuously acknowledged as the world’s leading data visualization solution for developers. As AnyChart JS forms the cornerstone of our broader product line, this recognition once again highlights the technological excellence and innovation inherent in our entire suite of offerings, including the extensions for Qlik Sense.
- Categories: AnyChart Charting Component, AnyGantt, AnyMap, AnyStock, Big Data, Blogroll, Business Intelligence, Dashboards, Financial Charts, Gantt Chart, HTML5, JavaScript, News, Oracle Apex, Qlik, Stock Charts, Success Stories
- No Comments »