Recap of the Week – 8/23/2015
August 24th, 2015 by Margaret SkomorokhIn this post you will find a recap of the exciting visualizations we have shared with you this week on AnyChart Facebook Page and Twitter:
- Place Poetry – a playful mobile application which enables people to arrange strangely named cities into poems, while simultaneously plotting the location and distance of their journey.
- Solar System of JS – an infographic about JavaScript.
- This neat interactive chart by The Guardian gives you the detailed information about gay rights in the US, state by state. It is definitely an example of a good data visualization (though the information is out-of-date).
- Stuff in Space is a realtime 3D map of objects in Earth orbit. One thing is to know how much stuff there is, and another thing is to see it with your own eyes.
- Categories: News
- No Comments »
AnyChart, AnyMap, and AnyGantt 7.6.0
August 13th, 2015 by Margaret Skomorokh
We are proud to announce 3 new releases – AnyChart 7.6.0, AnyMap 7.6.0, AnyGantt 7.6.0. Our team has been working hard to make our products even more aesthetically pleasing, and now all AnyChart charts have a new modern look and design (See the New Look and Theming feature). We have also added a number of other great improvements, and here are the most important of them:
AnyChart 7.6.0 New Features
 |
All AnyChart products now support the Theming feature which makes customizing and integrating charts easier. With Theming, you can set similar visual and functional settings for all charts without duplicating your code. Take a look at Gallery samples >> Learn more about Theming >> |
 |
Crosshairs are thin vertical and horizontal lines centered on a data point, which are useful when you want to locate a point precisely on your chart or to analyse data by comparing different charts. Take a look at a Gallery sample >> Learn more about Crosshair >> |
 |
Pie/Donut Charts are popular, nice-looking, and very easy to understand, and now you can make them even more attractive by adding 3D! Take a look at Gallery samples >> Learn more about 3D Pie Chart >> |
AnyMap 7.6.0 Features
- Choropleth Maps provide an easy way to visualize how a measurement varies across a geographic area.
- Ordinal Color Range looks like several boxes of different colors which depend on the palette chosen according to the type of a map and its data.
- Quantitative Color Range is a bar colored with a gradient, its colors depend on the palette of a map and its data.
- Full Compatibility with other Charts – when you need to show any extra information along with a map – no problem! Use AnyMap with any other charts.
AnyGantt 7.6.0 New Features
- Now a double-click on borders of data grid columns resets their width to the default value.
- Added the ability to draw the Baseline above the Actual, see API Reference for details.
- AnyGantt now supports formatting for Data Grid Columns, see API Reference for details.
AnyChart version history: https://www.anychart.com/products/anychart/history/
AnyMap version history: https://www.anychart.com/products/anymap/history/
AnyGantt version history: https://www.anychart.com/products/anygantt/history/
Trial download: https://www.anychart.com/download/
P.S. The set of ready-to-use maps is rather small for the moment, but we will add about a hundred maps in a week, and then the list will just keep growing.
- Categories: AnyChart Charting Component, AnyGantt, AnyMap, HTML5, JavaScript, News
- No Comments »
AnyStock Alpha Preview
August 3rd, 2015 by Margaret Skomorokh
AnyChart Stock 7 is an upcoming addition to new AnyChart 7 HTML5 JavaScript Engine: Financial charting solution that allows to turn your real time data into highly sophisticated charts with interactive capability.
Designed to display large datetime datasets, AnyStock is the ideal tool for client reporting and performance based reporting applications. Reports and Dashboards are visualized with scrolling, drill downs, panning and zoom functionality.
Demo page: https://www.anychart.com/products/anystock/demos/alpha/
What you can see on a demo page is the early Alpha preview of AnyStock, this chart shows dataset of 20.000 points and it usually takes about half a second to be rendered in a modern browser on an average workstation. The title of the chart you see shows results of the real performance benchmark for this chart on your computer.
We are working hard to go into the release stage, polishing all bells and whistles and hoping to make it by September 2015.
New AnyStock will feature amazing speed and all the neat things our customers loved previous versions of in AnyStock, and it will be fully integrated into the new AnyChart 7 Framework and share most of its ideology, settings technique and ease of use – and you will be able to use it along other charts, including those we have in the AnyChart Basic Charts, AnyGantt Gantt Charts and AnyMap HTML5 Maps.
We are convinced that you will be pleased with the result, stay tuned!
- Categories: AnyStock, HTML5, JavaScript, News
- 2 Comments »
AnyMap News and Recap of the Week
July 26th, 2015 by Margaret SkomorokhGood news, everyone! We are putting finishing touches on the new AnyMap HTML5 engine, along with the new version of AnyChart with an amazing Theming Feature: ability to segregate settings and data once and till the end of times (if you wish to) and switch visual presets on-the-fly. And we are going to show the first demo of AnyStock HTML5 next week too.
Also, some interesting stuff we’ve encountered this week and covered on AnyChart Facebook Page:
We’ve noticed Line Charts in Age of Wonders III and Triumph Studios spotted that we were on the tutorial level.
Two great projects from the UK:
- Seeing Data: Making Sense of Data Through Visualisations is a research project which aims to understand how people make sense of data visualisations, the project is headed by Helen Kennedy, Professor of Digital Society at the Department of Sociological Studies, University of Sheffield.
- Compound Interest is a site that aims to take a closer look at the chemical compounds we come across on a day-to-day basis. It also provides graphics for educational purposes, both for teacher and student use. The site is run single-handedly by Andy Brunning, a chemistry teacher based in the UK who creates the graphics for the site in his spare time.
- Categories: AnyChart Charting Component, AnyMap, AnyStock, News
- No Comments »
Recap of the Week – 7/20/2015
July 20th, 2015 by Margaret SkomorokhThis week we have posted the following news on data visualization, data science, and AnyChart:
- This nice animated infographic by CNNMoney shows how the median home in America has changed of the past 40 years.
- Read the article by Explorer (UK) Ltd about AnyChart Pie Charts in Oracle Application Express (APEX).
- On July 23, 2015, a Big Data meeting will be held online. Participation is free, but you need to register in advance. The group is meant to be a hub for those involved in Big Data and Data Science in the world. Meetings will be monthly in online to discuss architecture, challenges, solutions , products and ideas that Big Data companies are facing and to learn from fellow Big Data professionals.
- Check out this animated map showing how Hinduism, Buddhism, Christianity, Judaism, and Islam spread across the world.
By the way, we are going to update AnyChart Maps – AnyMap in a matter of days, it will be a completely new, HTML5-ready JavaScript maps engine.
Stay tuned!
- Categories: AnyChart Charting Component, News
- No Comments »
Recap of the Week – 7/12/2015
July 12th, 2015 by Margaret SkomorokhHere is a quick recap of the interesting information on data visualization, which we have discovered this week – and, of course, of some AnyChart news:
- This incredibly detailed map shows how Europe’s population changed from 2001 to 2011. It is the first ever to collect data published by all of Europe’s municipalities, so it provides a level of detail previously unavailable.
- We have released AnyChart 7.5.1 – a new version of our HTML5 charts with some bugs fixed. Read more on our blog.
- In July 2015, a Coursera course in data visualization is back. This is an excellent opportunity for everyone involved to broaden their knowledge!
- How do you manage a remote team? Read tips from 6 experts (one of them is from AnyChart).
- Categories: AnyChart Charting Component, News
- No Comments »
AnyChart 7.5.1 Available – new version of our HTML5 charts
July 8th, 2015 by Margaret SkomorokhAnyChart 7.5.1, a bug fix release of our HTML5 charts, is now available. This version contains the following changes:
Improvements
- Improved the Animation feature.
Bug fixes
- Fixed the bug with multiple markers in Circular Gauges.
- Solved the issue with the min/max bubble size in Bubble Charts.
- Fixed the bug with Inside Labels incorrect overlapping in Pie Charts.
We are sorry for any inconveniences caused by the bugs. Our team is constantly working to improve AnyChart and achieve the best quality possible. And you’re always welcome to submit any questions to our support system.
AnyChart version history: https://www.anychart.com/products/anychart/history/
Trial download: https://www.anychart.com/download/
- Categories: AnyChart Charting Component, HTML5, JavaScript, News
- 1 Comment »
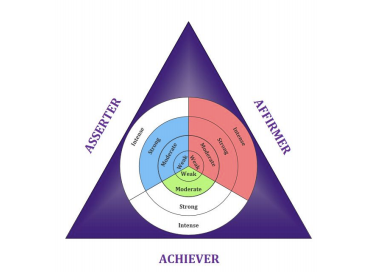
Sparks & Associates Chooses AnyChart to Visualize Assessment Results using JavaScript pie chart
July 3rd, 2015 by Margaret SkomorokhToday we are glad to publish a new customer success story – about AnyChart and Sparks & Associates.
 The Actualized Leadership Profile (ALP) is a 77-item self assessment that measures an individual’s dominant motive need and corresponding style of leadership. Based on the seminal works of Abraham Maslow and David McClelland, the ALP measures the degree of self-actualization that is demonstrated in one’s current style of leadership. A customized, full color and confidential report identifies the strengths and limitations in the individual’s current leadership approach.
The challenge was:
- To provide a creative and intuitive visualization of personal assessment results.
- To create a visualization that accepts result parameters from the system’s existing ASP code.
Solution:
- AnyChart JavaScript (HTML5) component was chosen as a solution. The flexibility of the AnyChart.graphics technology allowed to nest several pie charts and create a multi-level JavaScript pie chart not available from other chart vendors.
- AnyChart provides the flexibility to use customized background visualizations.
You can enjoy the full success story here:
|
Sparks & Associates Sparks & Associates Chooses AnyChart to Visualize Assessment Results >> |
Or see other AnyChart Customer Success Stories.
- Categories: AnyChart Charting Component, HTML5, JavaScript, News, Success Stories
- No Comments »
AnyChart 7.5.0 and AnyGantt 7.5.0 Released – new version of our HTML5 charts
June 18th, 2015 by Margaret SkomorokhGood news! Today we have two major releases of our HTML5 charts for our customers: AnyChart 7.5.0 and AnyGantt 7.5.0. In the new versions of our components, you will find the Funnel and Pyramid chart types, Dashbording Tools, the Printing and Animation options, and other significant improvements. Check them out:
AnyChart 7.5.0 New Features
 |
Dashboarding Tools The purpose of Dashboarding Tools is to provide simple and convenient instruments for building complex Dashboards. In the current release we present the first part of this set: the ability to highlight/hide series and points, using special methods. See API Reference for more details >> |
 |
Printing The new printing method allows you to make a full-page print of a chart or a dashboard. It supports eight paper size formats: US Letter, A0 – A6, and the portrait/landscape switch. Read more about Printing >> |
 |
Animation Most popular charts types – Line, Column, Bar, Area, and so on – are now animated. Animation supports duration settings and start&finish events. Take a look at the Gallery samples >> |
 |
Funnel Charts Funnel charts (also called accumulation charts) show percentage ratio. They are often used to represent different stages in sales process and show the amount of potential revenue for each stage. Read more about Funnel Charts >> Take a look at the Gallery samples >> |
 |
Pyramid Charts Pyramid charts are used to visualize the hierarchical structure of topics, and progressively ordered quantitative data. Read more about Pyramid Charts >> Take a look at the Gallery samples >> |
AnyGantt 7.5.0 New Features
 |
Printing The new printing method allows you to make a full-page print of your chart. It supports eight paper size formats: US Letter, A0 – A6, and the portrait/landscape switch. Read more about Printing >> |
 |
Events Events allow to handle such user actions as rowClick, rowMouseOver, rowMouseMove, etc. with the .listen() and .listenOnce() methods. Using this methods, you can override default chart interactivity. |
 |
XML/JSON/CSV Data Support The XML and JSON formats can be used for data and settings input; CSV can be used for data input. XML and JSON schemas are available. Learn how you can work with data >> |
 |
Summary Tasks Auto-Calculation The actualStart, actualEnd, and progressValue data fields of grouping tasks became optional. If they are missing, auto-calculation is done, based on tasks in the group. Take a look at the Gallery sample >> |
AnyChart version history: https://www.anychart.com/products/anychart/history/
AnyGantt version history: https://www.anychart.com/products/anygantt/history/
Trial download: https://www.anychart.com/download/
- Categories: AnyChart Charting Component, AnyGantt, Dashboards, Gantt Chart, HTML5, JavaScript, News
- No Comments »
Happy Easter
April 24th, 2011 by Margaret SkomorokhWe wish a happy Easter and a happy week ahead filled with energy and joy to all our existing and future clients!
By the way, a lot of great news is coming soon.
- Categories: News
- No Comments »