JavaScript Drawing Library GraphicsJS 1.2.0 Released + Introduction from SitePoint
May 3rd, 2017 by AnyChart TeamGraphicsJS, our powerful JavaScript drawing library that we open-sourced last year, has recently got an update to version 1.2.0. It is the next best news of 2017, a great addition to winning a Devies Award with GraphicsJS for the category “JavaScript Technologies” and to the 7.13.0/7.13.1 releases of our JS/HTML5 charting solutions AnyChart, AnyStock, AnyMap, and AnyGantt.
So, we invite you to take a very quick look at the most important updates (we’ll highlight the two below). And then – in case you want to feel the real power of JavaScript drawing and have not used GraphicsJS in your business or fun web projects yet – we are sharing a nice article published on SitePoint just recently. It is an introduction to GraphicsJS based on two tutorials. They will guide you through the most valuable features of this JavaScript drawing library and demonstrate them in action, and you’ll learn how to easily create a naïve art picture and a time-killer game.

JavaScript Drawing with GraphicsJS: Main Improvements
- Closure library and Closure compiler were updated to version 20161024.
- Enjoy an improved JavaScript drawing performance! In particular, we optimized the process of obtaining a link to a container for the stage. Also, resize events are now handled with the help of the Timer object, not the iFrame element.
Now, you are welcome to read the SitePoint article about GraphicsJS. Please do not forget to ask your questions, if any. You may do that by leaving a comment here right below the article.
- Categories: Charts and Art, GraphicsJS, HTML5, JavaScript, News, Tips and Tricks
- 2 Comments »
JavaScript Charts Library Update 7.13.1 Released for AnyChart, AnyStock, AnyMap, AnyGantt
April 18th, 2017 by AnyChart Team “Sweet April showers do spring May flowers,” once wrote 16th-century English poet Thomas Tusser. Well, our customers already know that AnyChart’s April brings flowers, too! Last year we launched the great 7.10.0 version of the AnyChart JavaScript charts library and, basically, of our whole data visualization product family. Now, in the year of 2017, April brings you another great update.
So, please all greet the 7.13.1 release of AnyChart, AnyMap, AnyStock, and AnyGantt – our cute first spring flowers grown especially for you!
- Categories: AnyChart Charting Component, AnyGantt, AnyMap, AnyStock, HTML5, JavaScript, News, Qlik
- 2 Comments »
25 Data Visualization Examples for One Dataset, Animated Map of Twitter Reactions During Oscars, and More | DataViz Weekly
March 17th, 2017 by AnyChart Team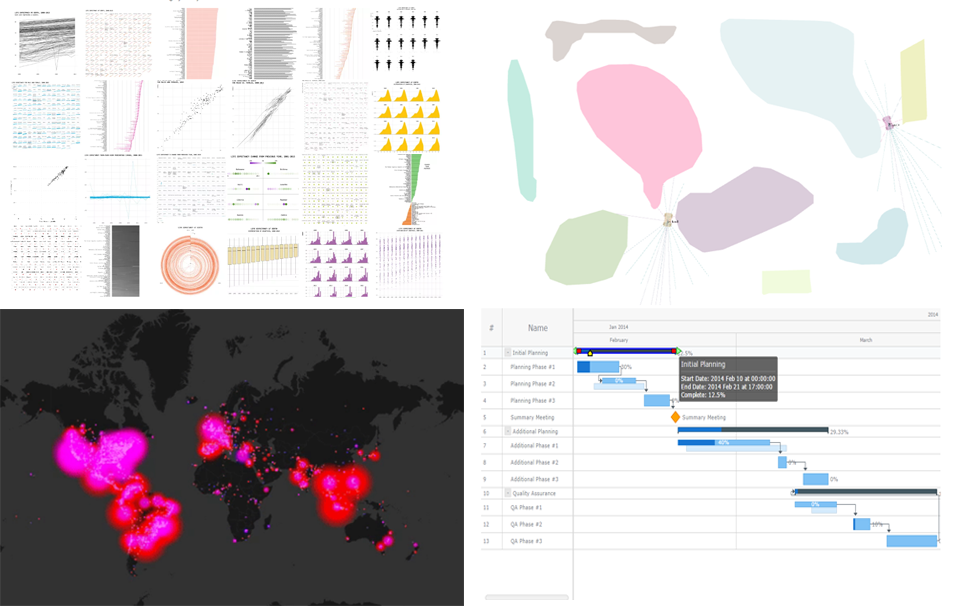 25 data visualization examples of how you can present the same dataset, an animated map of Twitter users’ reaction during this year’s Oscars, JavaScript-based self-driving cars, and an interactive Gantt chart sample with customized connectors in the Live Edit mode. These are the masterpieces that we are highlighting in today’s Data Visualization Weekly post.
Without more ado, let’s get to our latest collection of popular and most shared new charts from around the Web.
- Categories: Charts and Art, Data Visualization Weekly, News
- No Comments »
Data Visualizations of the Week: JS Frog Column Chart, Seeing Theory, and More
March 10th, 2017 by AnyChart Team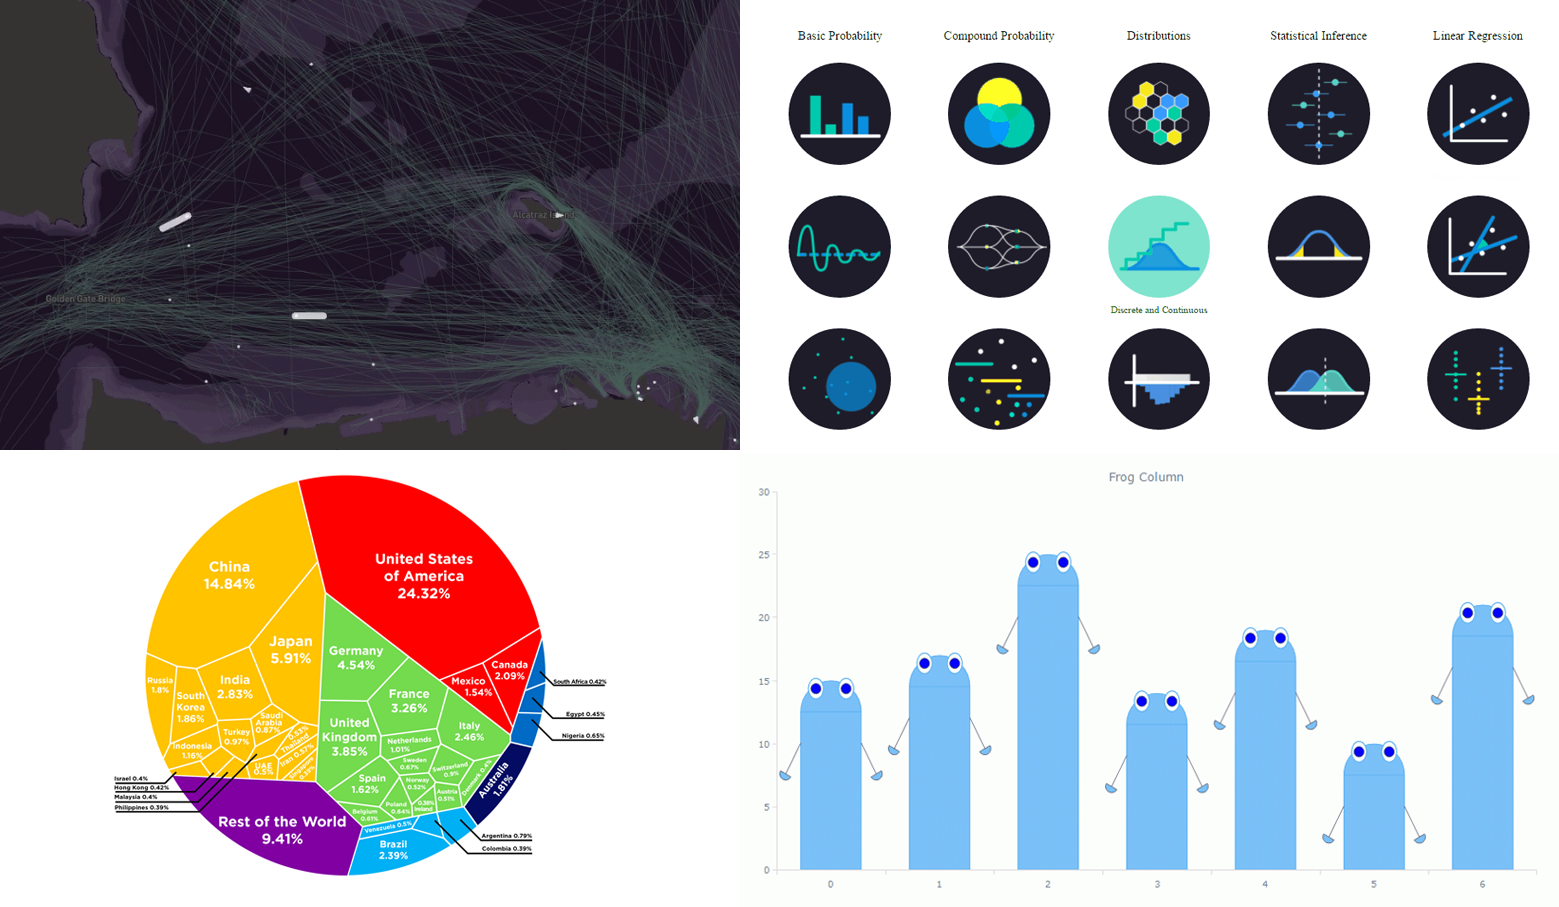 Now it’s time to say hello to last week’s most eye-catching data visualizations. As always, choosing just some of the best new and most popular pieces is a difficult task. But we are more than glad to do that for Data Visualization Weekly! And please don’t stop making more and more charts, people! That’s pleasant and greatly inspiring to see so many cool data visualizations emerge every week. Examining them also allows all of us to keep learning from the best practices, expand the vision, and further improve skills and understanding.
Today’s Data Visualization Weekly issue highlights the following four great presentations:
- animated map of shipping in the San Francisco Bay;
- interactive visualization of statistics and probability;
- Voronoi diagram of the global economy;
- “frog” column chart of whatever you need.
- Categories: Charts and Art, Data Visualization Weekly, News
- No Comments »
Data Visualization Weekly: Recent Popular Interesting Charts, Maps, and Infographics
March 3rd, 2017 by AnyChart Team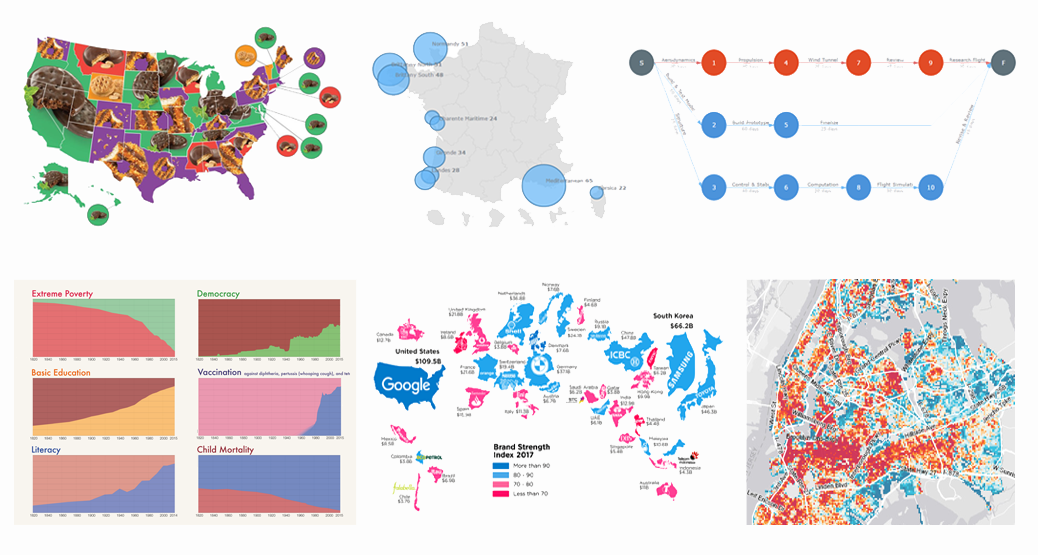 We are back with another collection of interesting charts, maps and infographics being popular lately. As you probably noticed, our Data Visualization Weekly series took a short break. In fact, no new issue came out last week. But the reason is simple and (hopefully) excusable. In fact, we were working really hard to get things done with the exciting major 7.13.0 update that our JavaScript charting libraries has received earlier this week.
Now the source code of AnyChart, AnyMap, AnyStock and AnyGantt is open. Plugins for all popular JS frameworks are available. And all the new features from the 7.13.0 release work great. That means we can finally get back to you to showcase new data visualizations that people followed most on our Twitter, Facebook and LinkedIn accounts over the last days. Moreover, the current issue of Data Visualization Weekly will cover the last two weeks instead of just one, to reimburse you for the delay. So, let’s take a look at the following great visual pieces now:
- Most Popular Girl Scout Cookies;
- History of Global Living Conditions in Interesting Charts;
- Interactive Map of Popular Surfing Areas in France;
- Most Popular Brands in Each Country;
- PERT Chart of Airplane Design Process;
- Revealing Age of Buildings in New York City.
- Categories: Charts and Art, Data Visualization Weekly, News
- No Comments »
AnyChart JavaScript Charting Libraries 7.13.0 Released, Source Code Opened
February 28th, 2017 by AnyChart TeamReliability has always been our main priority at AnyChart JS Charts. And you definitely know you can trust us, with our JavaScript charting libraries’ public roadmaps, consistent releases, and highly experienced Quality Assurance team. Today we are glad to tell you about another major step that we have just taken in this regard:
AnyChart is now open!
 |
Basically, it means we fully opened the following: – Source code of our JavaScript charting libraries – it is now available for review and download on GitHub. – Issue tracker – so you can help us further improve our products, if you can/want. – Build scripts – to let you compile custom binaries with the chart types you need. – List of branches – to demonstrate our development cycle and prove you can trust us. |
However, that’s not all! In addition to becoming open, we introduced multiple important improvements and new features with the new major release. Let’s see now what else was added to the 7.13.0 versions of our JavaScript charting libraries – AnyChart (JS charts), AnyStock (timeline data based JS charts), AnyMap (JS maps), and AnyGantt (JS charts for project/resource management).
JavaScript Charting 7.13.0: New Features in AnyChart, AnyStock, AnyMap, AnyGantt
 |
Plugins To make using our JavaScript charting libraries with the most popular JavaScript frameworks as easy as possible, we created special plugins for AngularJS, Ember.js, jQuery, Meteor, Node.js, and React. Save your time and effort by using these plugins when utilizing one of these frameworks. |
 |
Social Network Sharing Now any JS (HTML5) chart powered by our JavaScript charting libraries can be easily shared on social networks Facebook, LinkedIn, Pinterest, and Twitter. We included this function in the context menu, so this can be quickly done from there. Properties specific to a particular social network can be set in the exports namespace. |
 |
Vertical Charts Most of the series in our AnyChart and AnyStock Javascript charting libraries are now also available in the vertical orientation. Whenever that is what you’re looking for, you are welcome to use the isVertical() method. To make the process of building the most popular vertical chart types even more straightforward, we added special constructors, verticalArea() and verticalLine(). Look at vertical charts in our Gallery. |
 |
Pareto Chart The Pareto chart, named after prominent economist and sociologist Vilfredo Pareto, is currently one of the most popular chart types in the field of management. And we simply could not make you get along without it anymore. So, let’s all welcome the Pareto chart type! Starting from the 7.13.0 version, AnyChart offers it out of the box. Now you can easily create a Pareto chart by using the anychart.pareto() constructor. |
 |
Step, Stick, Jump Line Charts Please also meet these major new arrivals to the list of chart types supported in AnyChart and AnyStock. We introduced Backward and Forward modifications of the Step chart as well as the Jump Line and Stick. The Step Line Forward and Step Line Backward charts are now available with the help of the stepDirection() method. To add a Jump Line chart or create a Stick chart, use the jumpLine() and stick() methods. |
 |
Custom Series Drawing Imagination is freedom. You definitely need to easily visualize your data exactly the way you see it. And we keep on doing our best to deliver you the ultimate customization features. Now we added the new rendering() method to AnyChart and AnyStock so you could put any creative idea into action and build any custom chart. Custom drawing examples: Frog Chart, Cherry Chart, and Column Chart with Rounded Edges. |
 |
Legend Customization We added new options to work with the legend in AnyChart, AnyMap and AnyStock. First, the itemsLayout() now lets you improve the legend’s visual appearance, especially when multiple series are displayed. Second, the legend can now be placed inside a data plot (the positionMode() method) to facilitate a more efficient use of space on a chart. Third, the drag() method allows you to easily position the legend on your JS chart. |
") |
New Technical Indicators To expand the range of stock JS (HTML5) charting opportunities available in AnyStock, we added more of technical indicators: Adaptive Moving Average (AMA); Modified Moving Average (MMA); Average True Range (ATR); KDJ; Bollinger Bands (BBands); Bollinger Bands %B (BBands %B); Bollinger Bands Width (BBands Width); Stochastic Oscillator (Fast / Slow / Full). Learn more of all the technical indicators in our Docs. |
 |
Individual Point Settings Sometimes applying individual settings to a particular data point can be very useful. Although that might not be habitual for stock JS (HTML5) charts, we decided to provide you with this great customization opportunity in the AnyStock JavaScript charting library. Starting from the 7.13.0 release, you are allowed use the allowPointsSettings parameter in the anychart.stock() constructor to enable this option. |
 |
Resource Chart Interactivity With the previous, 7.12.0 release of AnyGantt, we introduced the redesigned Resource chart. In the new, 7.13.0 version of this HTML5 / JS library, we are glad to present you several major new features added this time. First of all, now you can enable and adjust the Hover and Select interactivity settings in our new Resource charts. |
 |
Resource Chart Events With the previous, 7.12.0 release of AnyGantt, we introduced the redesigned Resource chart. In the new, 7.13.0 version of this JavaScript charting library, we are glad to present you several major new features added this time. First of all, now you can enable and adjust the Hover and Select interactivity settings in our new Resource charts. |
 |
Resource Chart Tooltips Third, we have also added Tooltips to the new Resource chart with the current 7.13.0 release of AnyGantt. They will help you display additional information about each activity you are visualizing, in a convenient, greatly interactive way. |
 |
Connector Customization in Gantt Charts Of course, we could not leave our Gantt charts without proper attention with regard to new features. This time we made tuning the visual appearance of the Live Editing mode in HTML5 Gantt charts more flexible by adding the new Connector Customization features. You are welcome to take a look at them in action in AnyGantt’s Gallery. |
We hope you like the 7.13.0 versions of our JavaScript charting libraries and enjoy the openness of AnyChart!
By the way, we have already scheduled the next major update on May 2017. Please see the roadmaps of AnyChart, AnyStock, AnyMap and AnyGantt in case you would like to find out what you will get with that release. All in all, 2017 is going to be no less fruitful in terms of new features in AnyChart JS Charts than the rich year of 2016!
Please contact our Support Team at any time when you have any questions or requests for new features. We’ll be glad to be of help, as always!
AnyChart’s version history: https://www.anychart.com/products/anychart/history/.
AnyStock’s version history: https://www.anychart.com/products/anystock/history/.
AnyMap’s version history: https://www.anychart.com/products/anymap/history/.
AnyGantt’s version history: https://www.anychart.com/products/anygantt/history/.
Download our JavaScript charting libraries: https://www.anychart.com/download/.
Purchase a license (renovated Buy page): https://www.anychart.com/buy/.
- Categories: AnyChart Charting Component, AnyGantt, AnyMap, AnyStock, Financial Charts, Gantt Chart, HTML5, JavaScript, News, Stock Charts
- 6 Comments »
Data Visualization Weekly: Interactive Dashboard of US States and More
February 17th, 2017 by AnyChart Team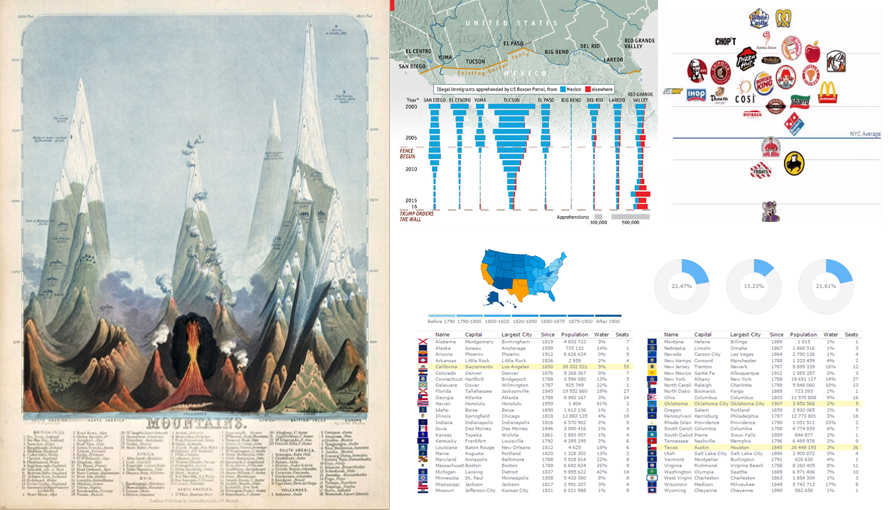 Data Visualization Weekly presented by AnyChart is here! In this new issue, we are glad to show you an interactive dashboard as well as maps and charts in another collection of the best and most followed dataviz masterpieces that we shared on Facebook and Twitter over the course of the last week. These include:
- Interactive Dashboard of US States
- Is Donald Trump’s Wall Necessary?
- Finding the Cleanest Restaurants in NYC
- Early Maps and Infographics of the 1800s
- Categories: Data Visualization Weekly, News
- No Comments »
AnyChart Wins 2017 Devies Award for Best JavaScript Technologies (PHOTO)
February 14th, 2017 by AnyChart Team We are proud to tell you today that our company AnyChart has won the JavaScript Technologies category at the 2017 Devies Awards! The ceremony took place yesterday in San Francisco, CA, as part of DeveloperWeek, the world’s largest developer conference and expo with 8,000 attendees. Our CEO Anton Baranchuk received the award on behalf of the AnyChart team.
The DeveloperWeek Advisory Board received hundreds of nominations and, of course, thoroughly studied how much we did last year. What excited the judges most was the public release of our JavaScript graphics library GraphicsJS. And they concluded that to be last year’s most notable innovation in JavaScript technologies, exceptionally meaningful to the whole web development community.
The Devies Awards celebrate the most innovative companies in the field of developer technologies across 13 categories. Together with AnyChart, among this year’s winners are industry giants Microsoft and IBM.
- Categories: Charts and Art, GraphicsJS, JavaScript, News, Success Stories
- 5 Comments »
Data Visualization Weekly: JS Multi-Series Line Chart DataViz and More
February 10th, 2017 by AnyChart Team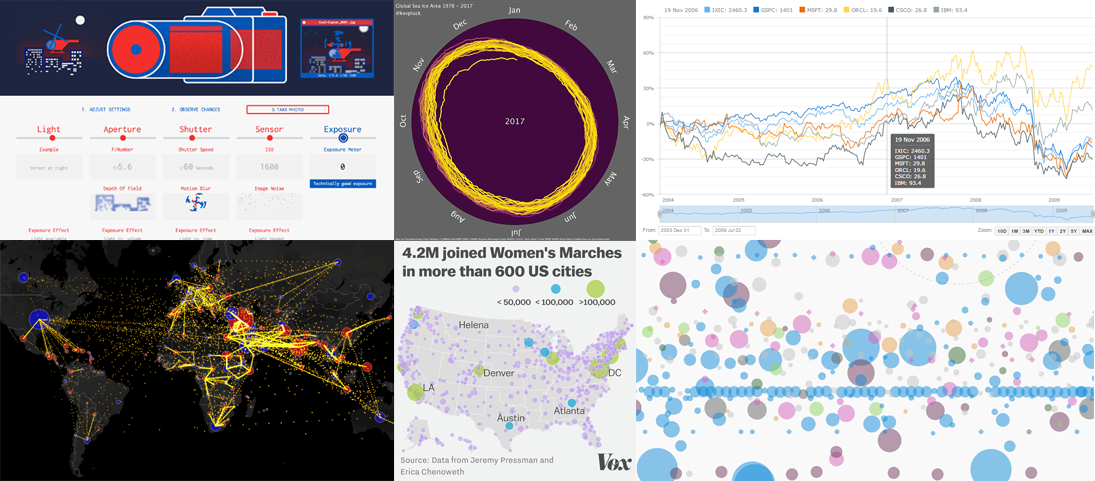 All dataviz lovers are welcome to the new issue of Data Visualization Weekly brought to you by AnyChart JS Charts! Today we are publishing the best and new chart, map and infographic examples shared on our Twitter and Facebook accounts during the last seven days.
So, get ready for the best peculiar practices that made the previous week in data visualization special! And now let’s take a look at what dataviz inspirations were most followed. Read more »
- Categories: Data Visualization Weekly, News
- No Comments »
Data Visualization Weekly: JS Polar Chart of Mic Sensitivity and More
February 2nd, 2017 by AnyChart Team
Data visualization weekly recaps became a tradition for our AnyChart Blog some time ago. Good news: we decided to resume it to highlight the best and new practices shared on our Facebook and Twitter accounts within the previous seven days. This means you will always be in the know of what charts, dashboards, maps, infographics, and video animations are trending and worth seeing.
As a matter of fact, data visualization is further evolving and gaining popularity as the best way to convey various information, whether it is in business reporting, analytics solutions, journalism, presentations, etc. That is why we are trying to monitor a lot of different sources and hope to deliver you the best of noteworthy, peculiar projects and practices for inspiration.
Now, let’s proceed to the visualizations that particularly caught our – and our followers’ – eyes during the last seven days, starting from January 27th, 2017. To put it in a nutshell first, the current data visualization weekly recap includes New York trees, Trump’s emotions, ocean salinity, words from Hamilton, US venture industry, and microphone sensitivity polar pattern. Read more »
- Categories: Data Visualization Weekly, News
- No Comments »