Qlik Sense Gantt Chart Extension AnyGantt Gets New Awesome Features in Version 4.0
November 1st, 2019 by AnyChart Team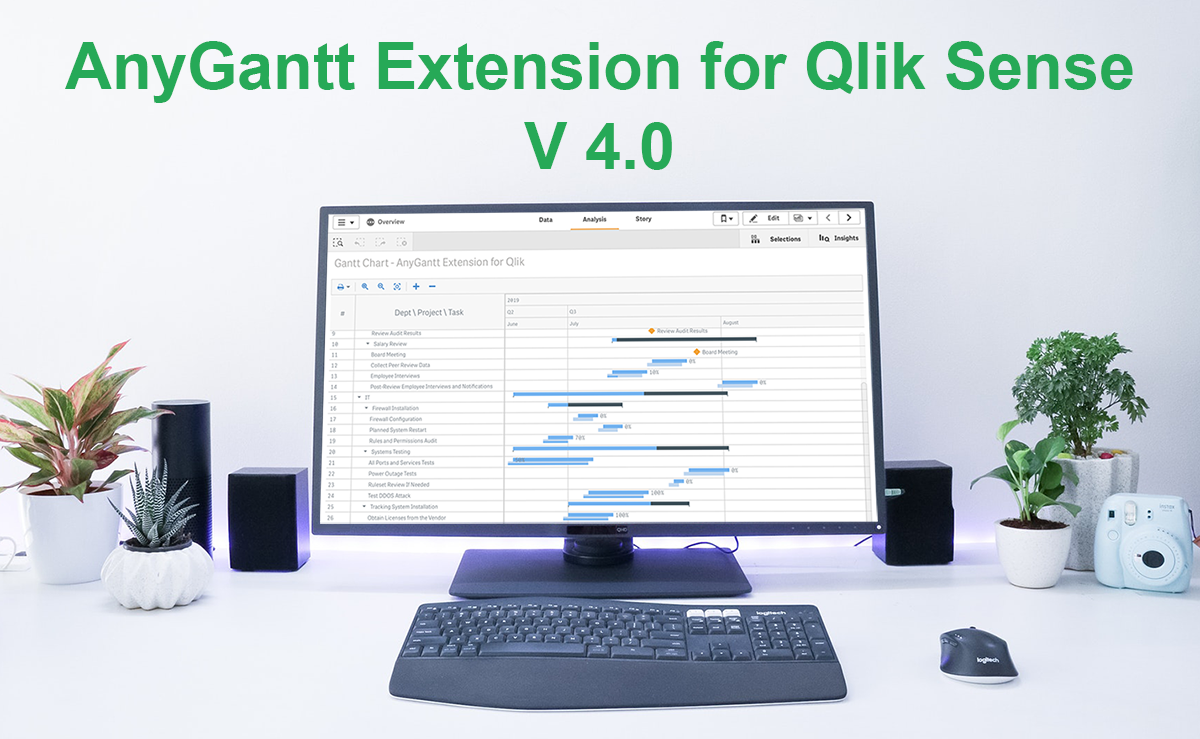 Good news, Qlikkies! We’ve released a major update to our Qlik Sense Gantt chart extension AnyGantt, bringing a bunch of new awesome features to further improve your project and resource data visualization experience using it. Look what’s new in version 4.0!
Read more at qlik.anychart.com »
- Categories: AnyChart Charting Component, AnyGantt, News, Qlik
- No Comments »
How to Create Gantt Chart in Qlik Sense Using AnyGantt Extension for Smart Project Data Visualization
September 11th, 2019 by AnyChart Team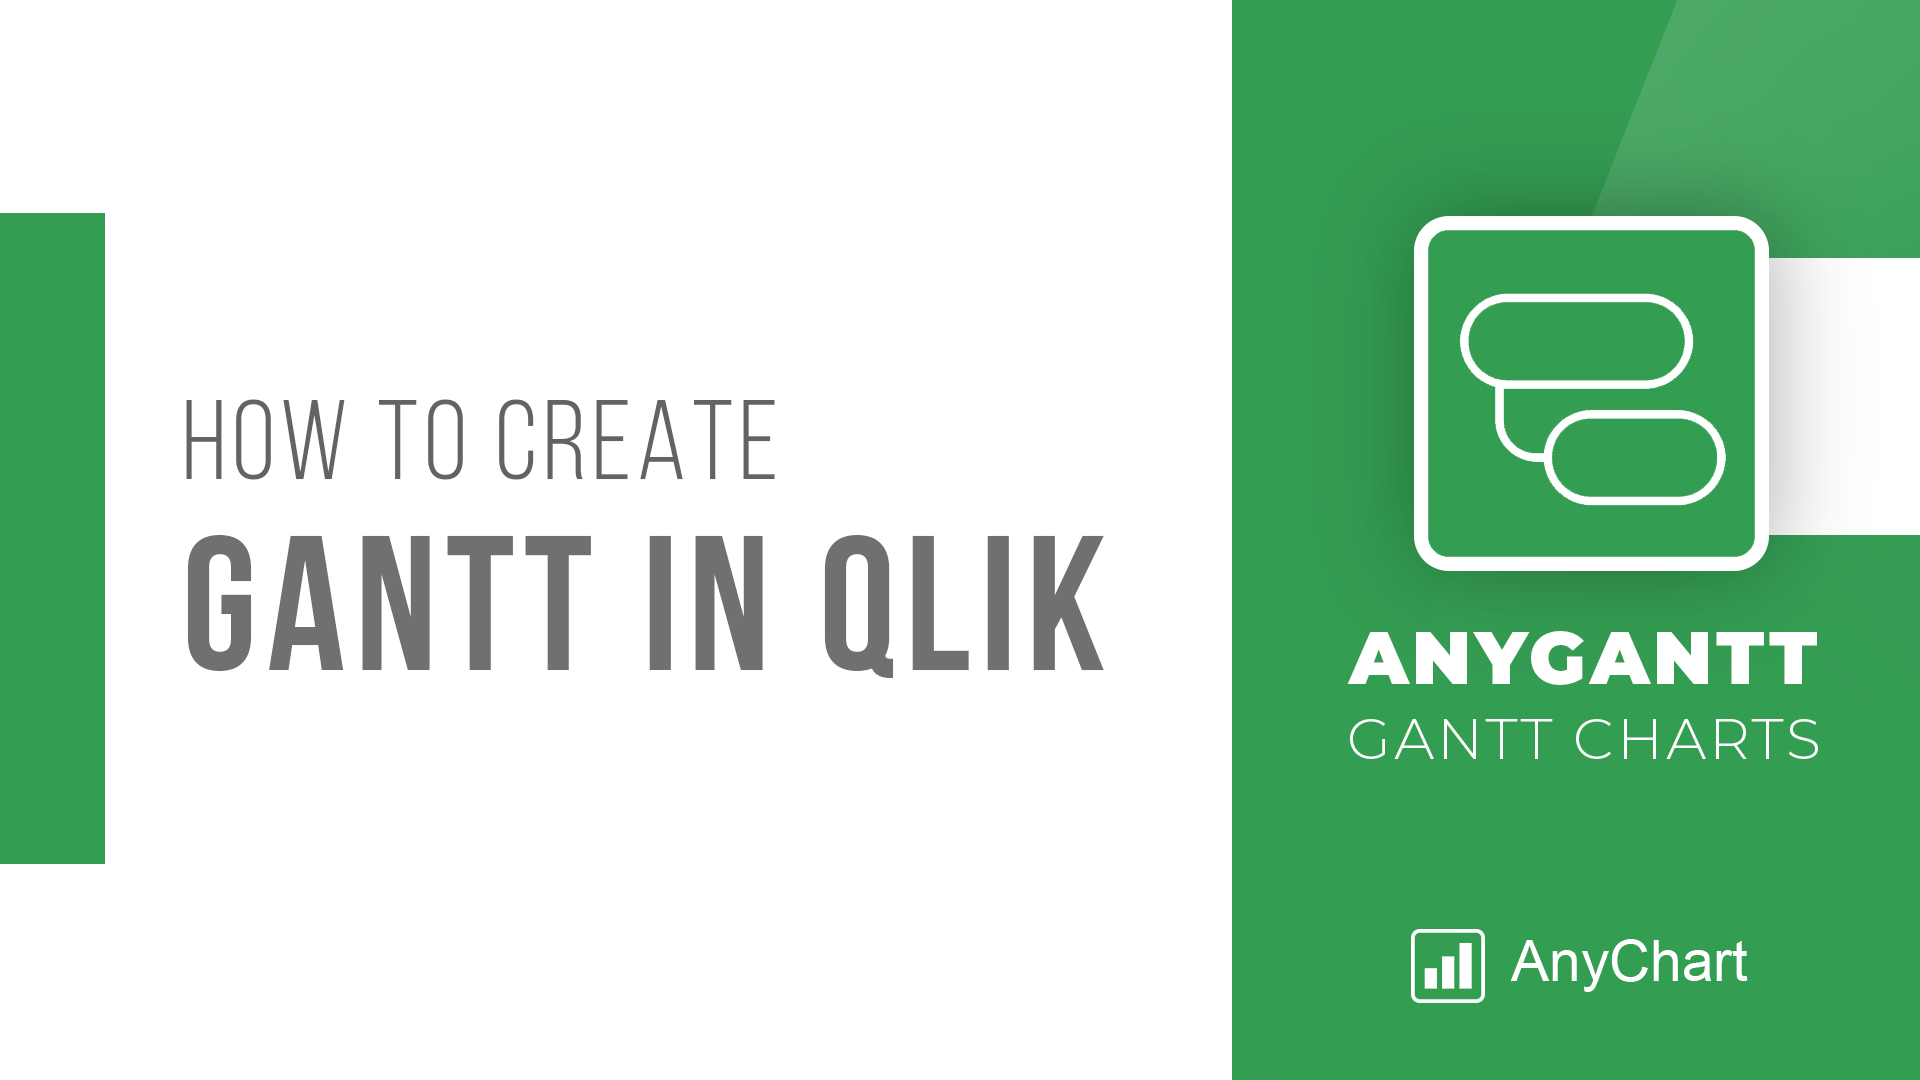 Looking for the simplest way to create a Gantt chart in Qlik Sense to further streamline data-driven project management in your company or organization? We’ll show you one right now! Follow this quick tutorial and you’ll learn how to easily visualize project tasks and activities as data in a matter of minutes — on smart, interactive Gantt charts using the intuitive AnyGantt extension for Qlik by AnyChart.
Watch the video tutorial or follow the text-and-pictures version — you choose!
Read more at qlik.anychart.com »
- Categories: AnyChart Charting Component, AnyGantt, Big Data, Business Intelligence, Gantt Chart, Qlik
- 3 Comments »
All 3 Extensions for Qlik Sense Updated with New Charting Features in Version 3.4
June 19th, 2019 by AnyChart Team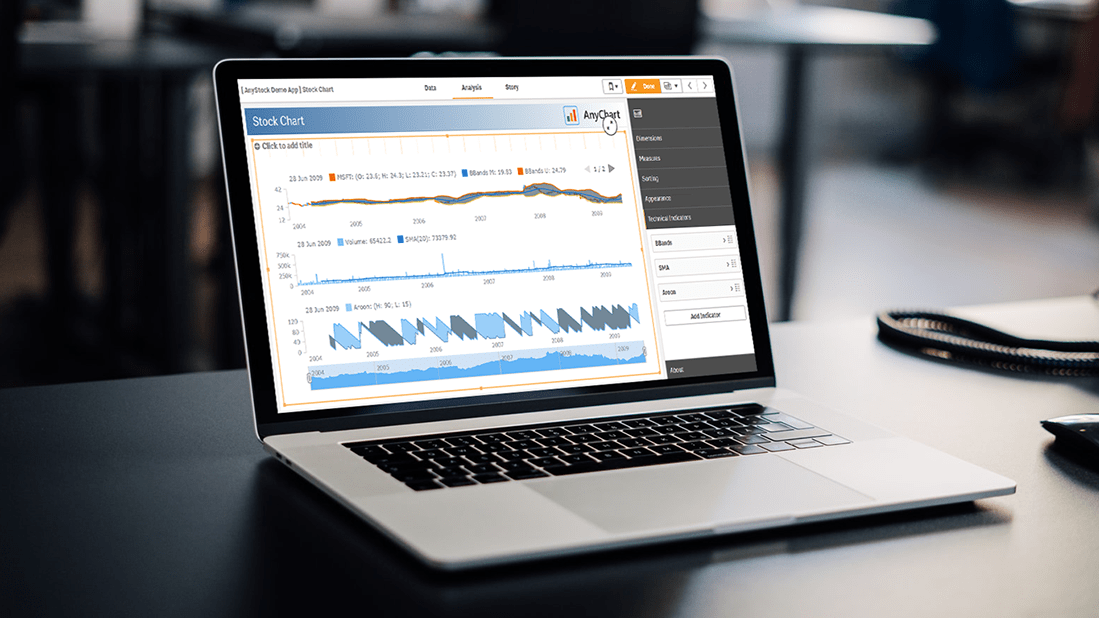 Hey Qlik users, we are happy to announce the release of version 3.4 for all our three extensions for Qlik Sense! We updated them with new awesome data visualization features and functionality such as technical indicators and more.
At last month’s Qlik Qonnections 2019 conference in Dallas where we exhibited as a new Qlik Technology Partner, we received amazing feedback from the Qlik community. We took that information and have already begun building out some of those requests for our next release of version 3.5 for our extensions for Qlik Sense, so please keep the feedback coming and we’ll keep building.
In the meantime here’s what we added.
Read more at qlik.anychart.com »
- Categories: AnyChart Charting Component, AnyGantt, AnyMap, AnyStock, Business Intelligence, Gantt Chart, Qlik, Stock Charts
- No Comments »
AnyChart Joins Qlik Technology Program and Adds 36 Chart Types to Qlik Sense in Just-Launched Extensions
May 7th, 2019 by AnyChart Team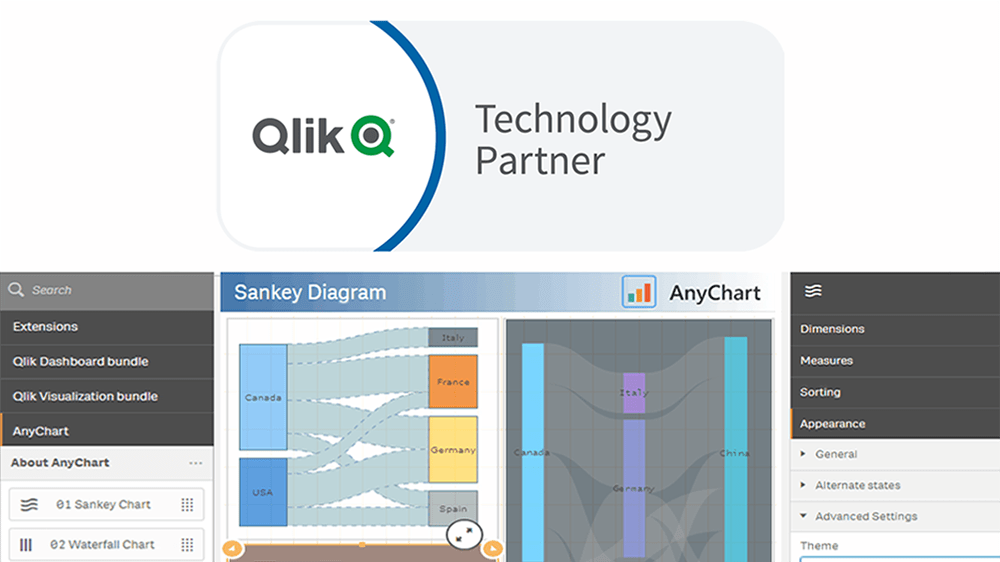
“We’re excited to be partnering with AnyChart, and their extensions will provide customers with additional choices for building even more compelling visualizations.”
— Mike Foster, Vice President, Strategic Partners at Qlik.
(Source: press release as of May 7, 2019.)
AnyChart crosses a new frontier! The vast data visualization capabilities of our award-winning JavaScript charting library, designed primarily for web developers and software engineers, are now available directly to data analysts and BI experts through powerful, flexible, intuitive extensions for Qlik Sense — AnyChart, AnyGantt, and AnyStock!
Read more at qlik.anychart.com »
- Categories: AnyChart Charting Component, AnyGantt, AnyStock, Big Data, Business Intelligence, Qlik
- 13 Comments »
Qlik Data Visualization Extension: Introducing Custom Drawing Over Custom Theme
January 16th, 2019 by Irina Maximova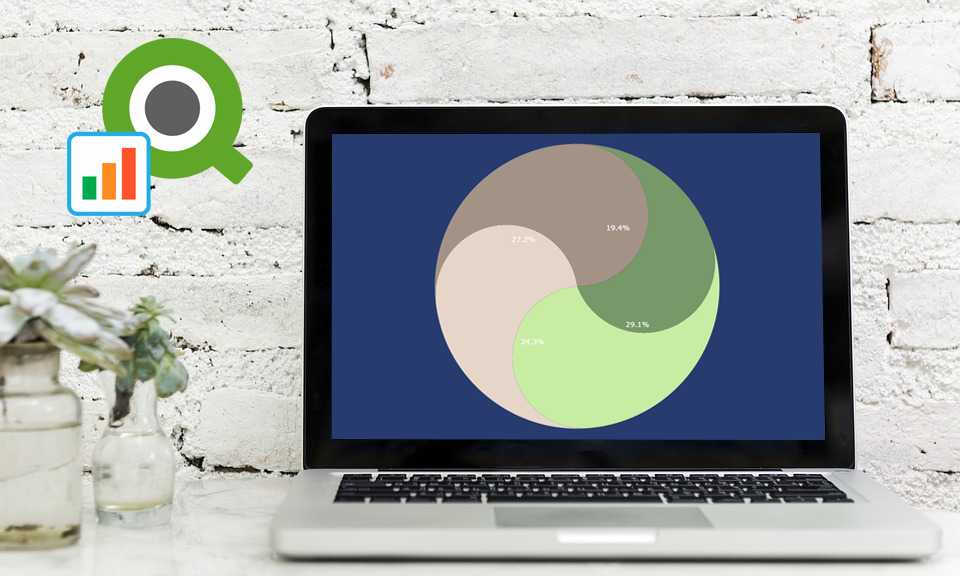 Our Qlik Charts Extension now allows a custom renderer to be set for certain chart types! We’ll show you how to make use of this new great feature in your Qlik data visualization practice, implementing custom drawing over a custom theme.
Before we begin, please note: We recommend getting acquainted with the custom drawing documentation of AnyChart JS Charts if you never worked with it before. When you do that, it will be easier for you to understand what the custom drawing functions are and how to use them right and best.
- Categories: AnyChart Charting Component, Business Intelligence, HTML5, News, Qlik, Tips and Tricks
- No Comments »
Qlik Extension: Introducing Configuration File Settings for Charts
December 20th, 2018 by Irina Maximova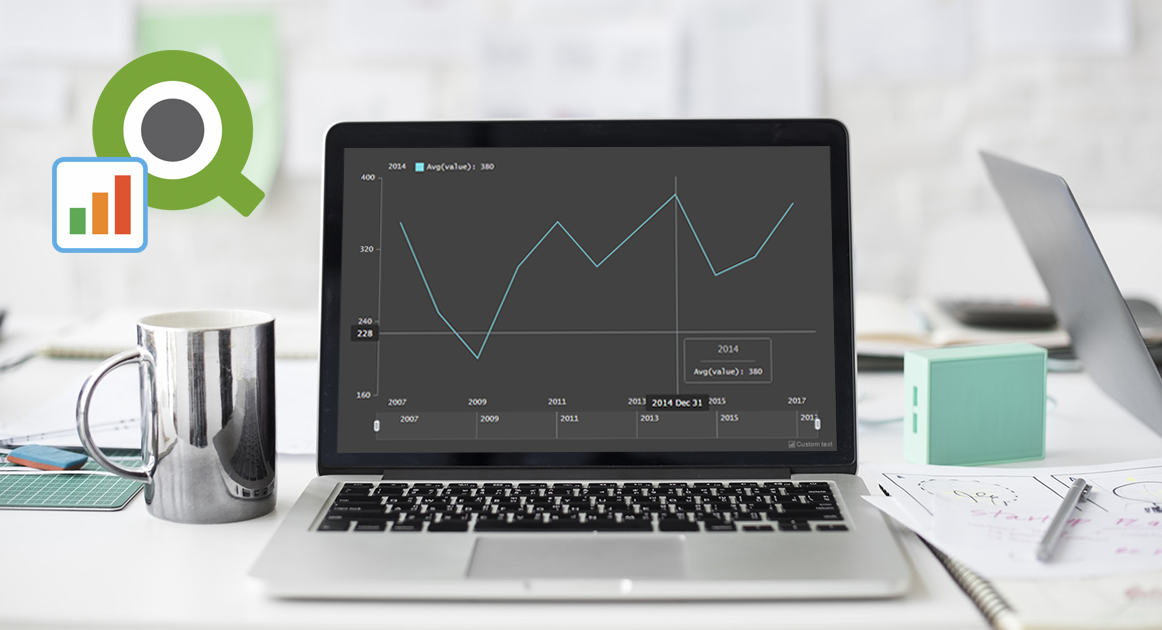 Another brand new AnyChart Qlik plugin feature has arrived: Now it is possible to change the default settings in the configuration file of our Qlik extension for data visualization!
AnyChart Qlik plugin’s configuration file allows you to apply the default settings to all charts and dashboards created by the extension and customize them, which is impossible to achieve in the chart editor itself.
- Categories: Big Data, HTML5, News, Qlik, Tips and Tricks
- 2 Comments »
Qlik Extension Gets Gantt Chart and Tag Cloud in Version 2.5.0
November 6th, 2018 by AnyChart Team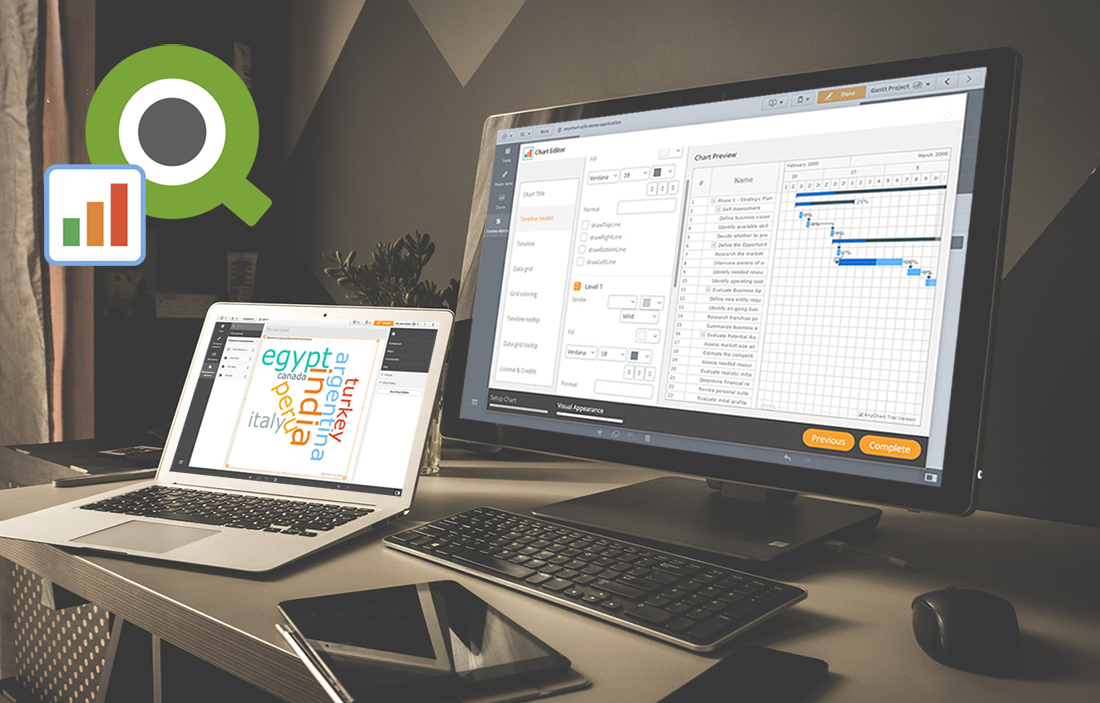 Following the 8.4.0 release of the AnyChart JS Charts library, now we’ve also got an awesome major update for our data visualization extension for Qlik Sense. Its version 2.5.0 is already available, adding Gantt Chart and Tag Cloud to the list of supported chart types.
Meet AnyChart Qlik Extension 2.5.0!
- Categories: AnyChart Charting Component, Qlik
- No Comments »
Qlik Charts Updated to Version 2.4.0, Now with Multiple Scales, Localizations, and More
June 14th, 2018 by AnyChart Team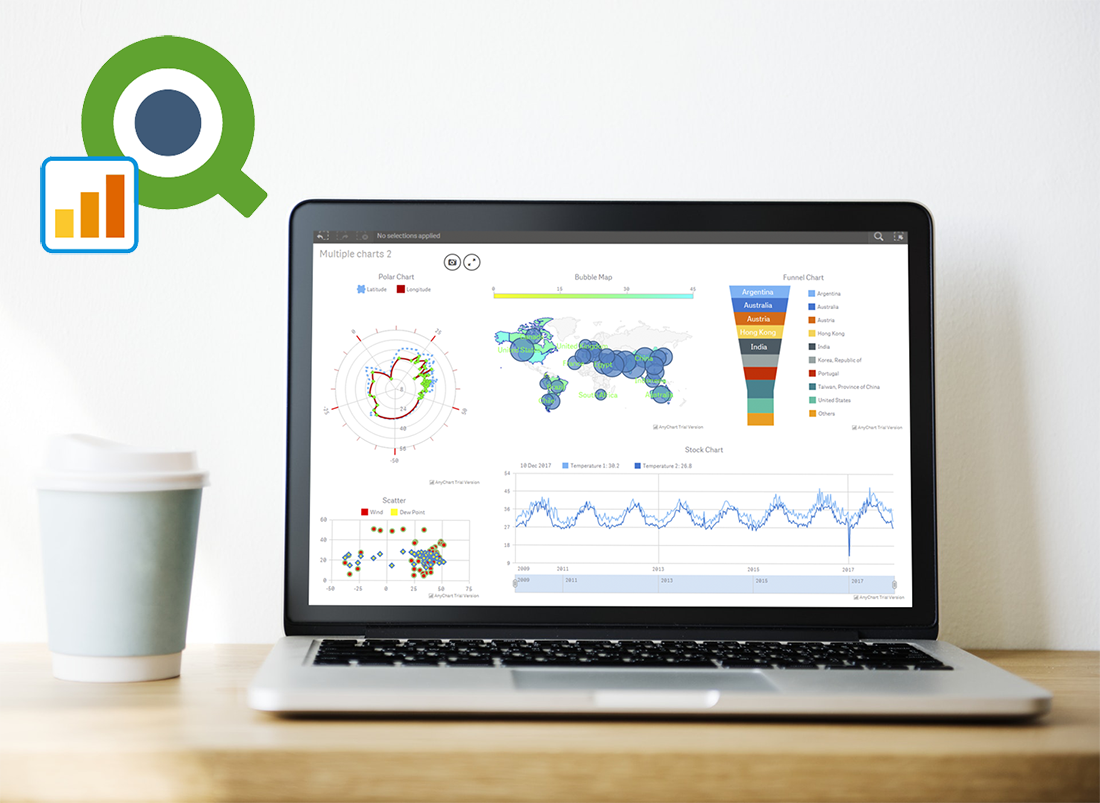 Great news for Qlik users! We’ve released version 2.4.0 of the AnyChart Qlik Extension. The latest update brings several important new features to Qlik charts: multiple scales, localization support, coloring controls for OHLC, candlestick and waterfall charts, as well as label rotation settings.
Learn more about the new version of our JavaScript (HTML5) charting library extension for interactive data visualization on Qlik data analytics platform, and what’s next in our plans.
- Categories: AnyChart Charting Component, HTML5, JavaScript, News, Qlik
- No Comments »
AnyChart Qlik Sense Extension 2.3.0 Released Featuring Linear and Circular Gauges
March 8th, 2018 by AnyChart Team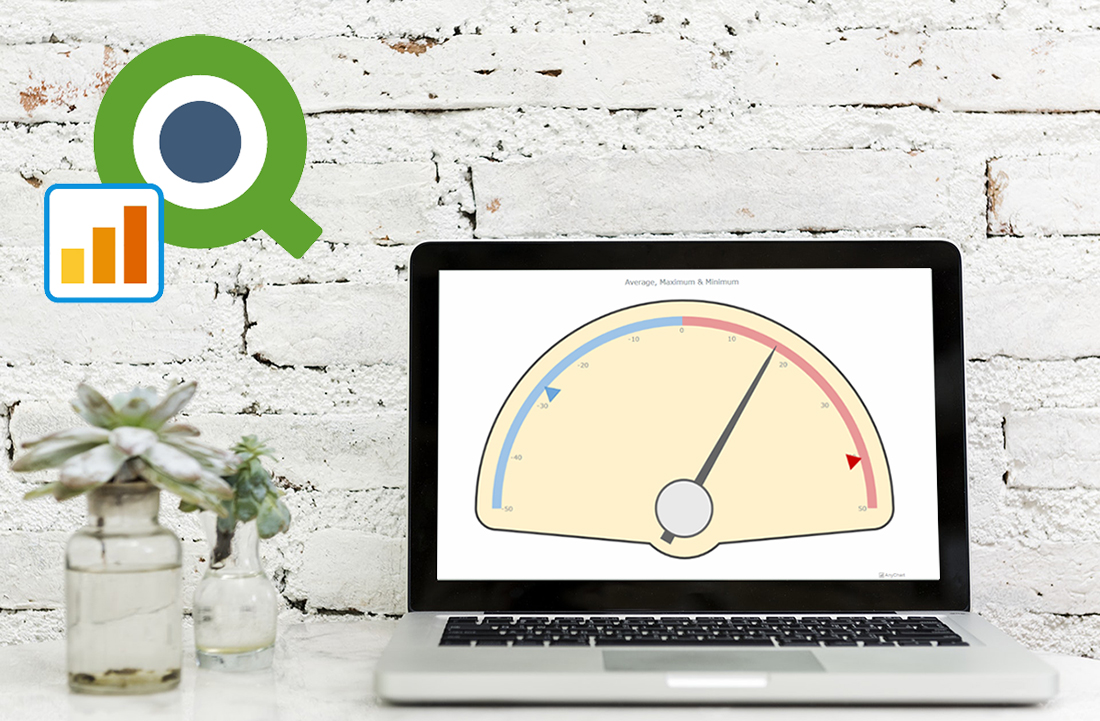 Less than four months have passed since we presented version 2.0 of our Qlik Sense extension for advanced data visualization. During that short time period, we released three more updates: 2.0.1, 2.1.0 and 2.2.0. And here’s a new one ready!
The latest update adds two new chart types – Linear and Circular Gauges – as well as several new important features, further extending the power of our JavaScript charting libraries to the Qlik Sense environment. Check out the details in a quick overview below.
- Categories: AnyChart Charting Component, HTML5, JavaScript, News, Qlik
- No Comments »
Best JavaScript Technology: AnyChart JS Charts Library Wins 2018 DEVIES Award!
February 6th, 2018 by AnyChart Team It’s happened! Our AnyChart JS Charts library has just been officially named the best in JavaScript Technology for innovation and received a prestigious DEVIES award in California! (See all the 2018 DEVIES winners — one for each of the 15 categories.)
2018 DEVIES is reported to be the world’s leading DevTech Awards event, taking place these days during DeveloperWeek in Oakland, CA, the largest developer expo and conference series globally.
- Categories: AnyChart Charting Component, AnyGantt, AnyMap, AnyStock, HTML5, JavaScript, News, Qlik, Success Stories
- 6 Comments »