Happy New Year in JavaScript Charting: AnyChart 8.1.0 Is Out!
December 20th, 2017 by AnyChart Team The New Year and Christmas are already just around the corner, and we have something astonishing for you in this magical time! The next major update for our product family of JavaScript charting libraries is now released, so meet AnyChart 8.1.0!
Check out what new cool and useful features are delivered in the new versions of our HTML5-based interactive data visualization solutions AnyChart, AnyStock, AnyGantt and AnyMap, as well as what we are going to work on next.
- Categories: AnyChart Charting Component, AnyGantt, AnyMap, AnyStock, Financial Charts, Gantt Chart, HTML5, JavaScript, News, Qlik, Stock Charts
- 2 Comments »
AnyChart Extension 2.0 for Qlik Sense Released, Fueling Flexibility in Data Visualization
November 15th, 2017 by AnyChart Team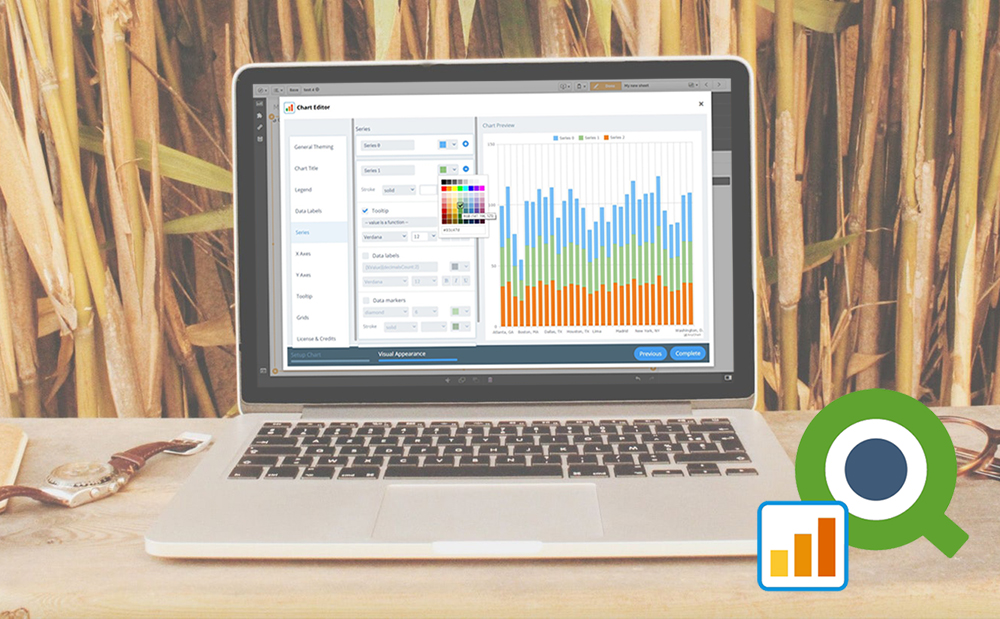 When AnyChart JS Charts‘ dedicated extension for Qlik Sense first hit the stage on Qlik Branch in the spring of 2017, it was well received by the community. In fact, we delivered what many Qlik users craved: advanced flexibility which at the same time would not affect the ease of interactive data visualization. And that was just the beginning.
Now, we are happy to present version 2.0 of our extension for Qlik Sense!
The major update has brought new chart types and elaborate features out of the box, sharing another portion of the ultimate data visualization power inherent in the AnyChart JavaScript charting library with Qlik users.
- Categories: AnyChart Charting Component, Business Intelligence, HTML5, News, Qlik
- 1 Comment »
Data Visualization with JavaScript: The Story of AnyChart JS Charts
September 7th, 2017 by AnyChart Team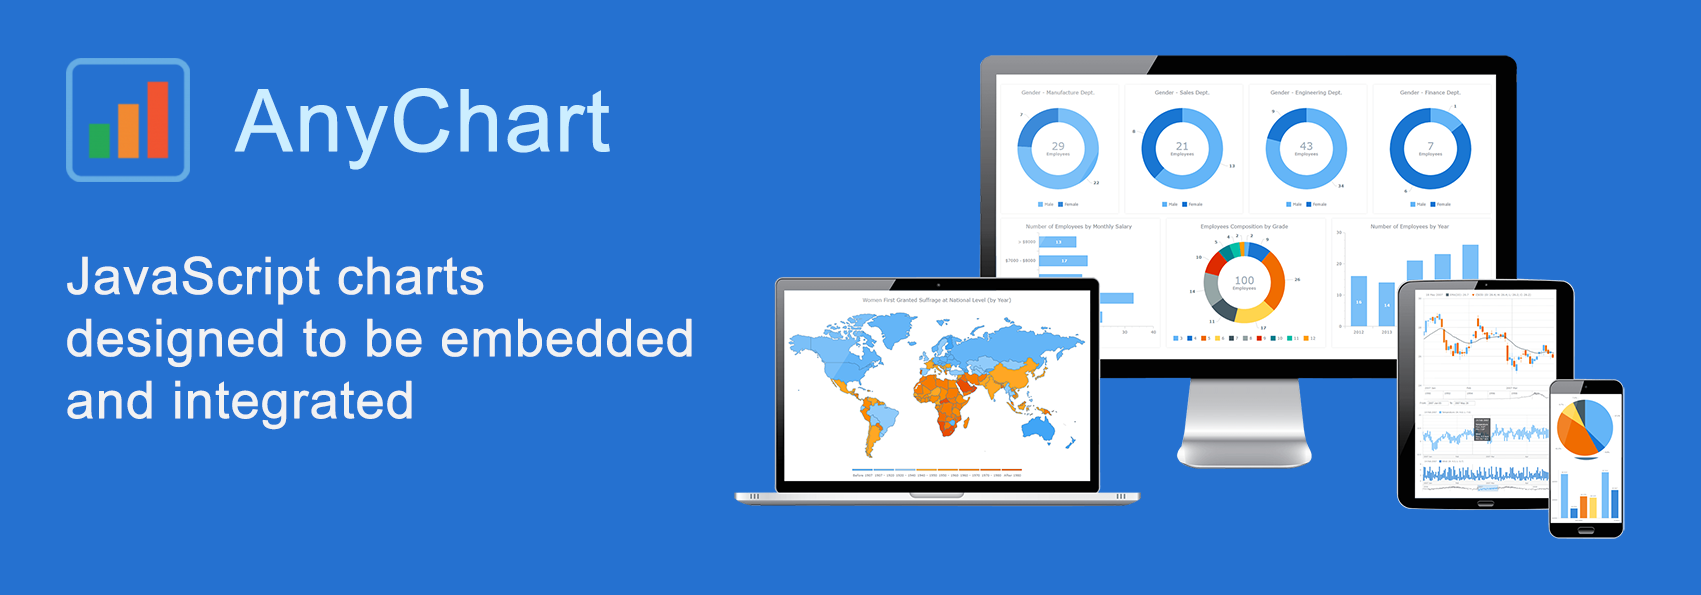 AnyChart is a flexible JavaScript (HTML5) based solution that allows you to create interactive and great looking charts. It is a cross-browser and cross-platform charting solution intended for everybody who deals with creation of dashboard, reporting, analytics, statistical, financial or any other data visualization solutions. AnyChart works everywhere -PCs, Macs, iPhones, iPads, Android devices and helps businesses transform operational data into actionable information.
Kevin William David interviewed Anton Baranchuk, CEO at AnyChart to know more.
- Categories: AnyChart Charting Component, AnyGantt, AnyMap, AnyStock, Business Intelligence, Flash Platform, GraphicsJS, HTML5, JavaScript, Oracle Apex, Qlik, Success Stories
- No Comments »
JavaScript Charts Library Update 7.13.1 Released for AnyChart, AnyStock, AnyMap, AnyGantt
April 18th, 2017 by AnyChart Team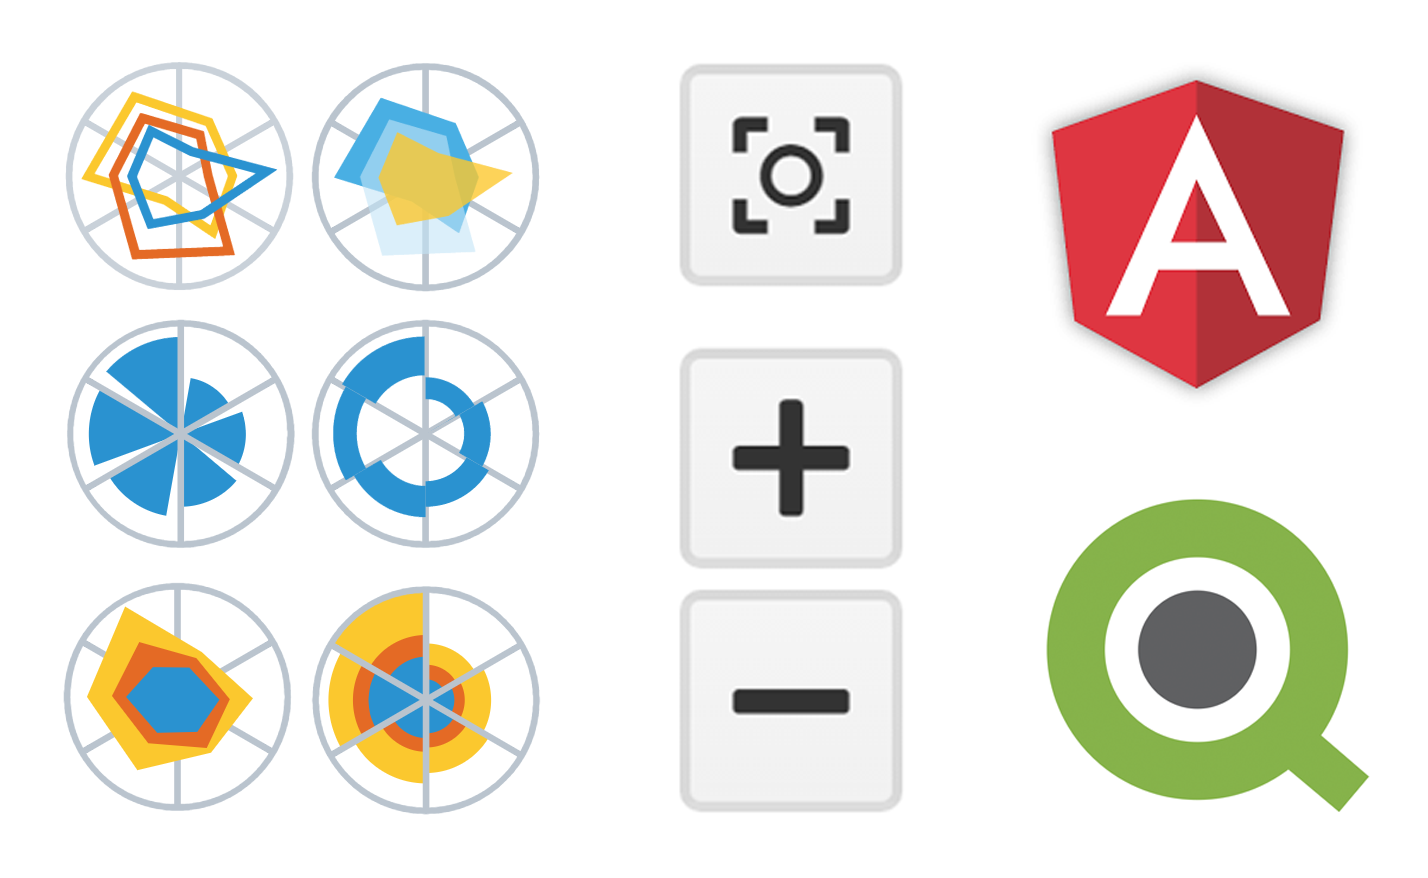 “Sweet April showers do spring May flowers,” once wrote 16th-century English poet Thomas Tusser. Well, our customers already know that AnyChart’s April brings flowers, too! Last year we launched the great 7.10.0 version of the AnyChart JavaScript charts library and, basically, of our whole data visualization product family. Now, in the year of 2017, April brings you another great update.
So, please all greet the 7.13.1 release of AnyChart, AnyMap, AnyStock, and AnyGantt – our cute first spring flowers grown especially for you!
- Categories: AnyChart Charting Component, AnyGantt, AnyMap, AnyStock, HTML5, JavaScript, News, Qlik
- 2 Comments »